Scientists have needed to employ expensive laboratory equipment which costs tens of thousands of dollars to measure surface tension in liquids. The Droplet Lab team developed a new method which combines smartphone processing power and sensors and cameras to produce research-grade surface tension measurements in an affordable compact design.
The method stands as a peer-reviewed scientific technique which appears in Colloids and Surfaces A. This article will explain the technical procedure step by step to demonstrate how smartphone-based surface tension measurement works and why it produces reliable scientific results and what performance indicators prove its dependability.
The Physics: Surface Tension from a Drop’s Shape
The principle is straightforward:
Gravity exerts a downward force on the pendant drop which leads to its expansion.
Surface tension operates as a force which draws molecules toward their original spherical arrangement.
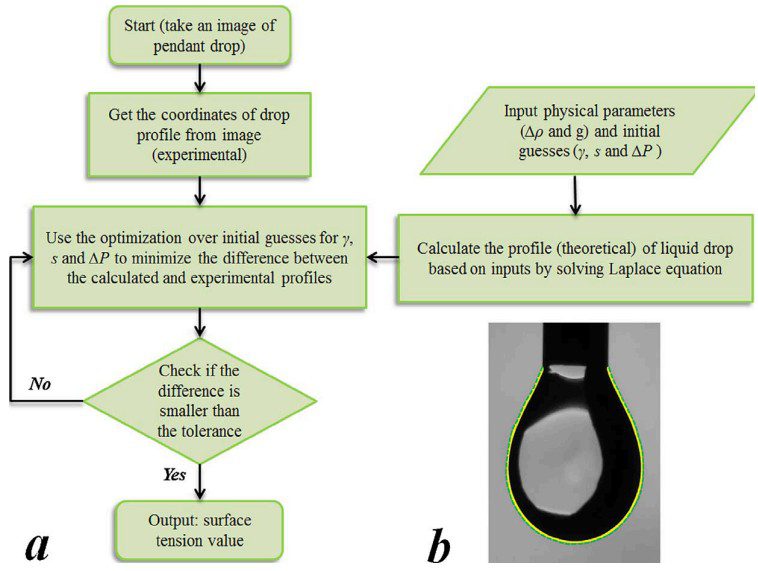
The shape of a pendant drop enables scientists to determine surface tension values. The Axisymmetric Drop Shape Analysis (ADSA) method compares a real droplet outline with a theoretical one created from the Young–Laplace equation to perform this analysis.
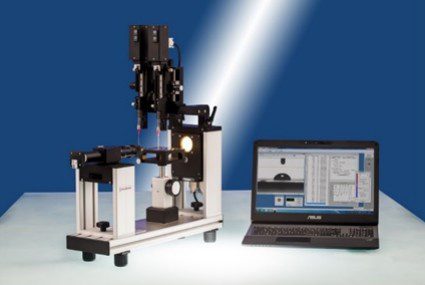
Traditional vs. Smartphone Setup
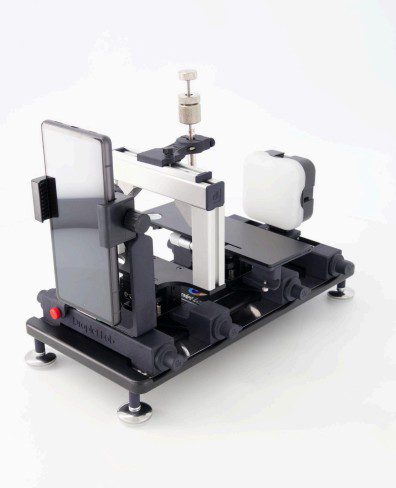
The traditional system depends on four main components which include a high-resolution camera, precision optics, a light source and a connected computer for image processing. The Droplet Lab team developed a new system which uses a smartphone instead of traditional cameras and computers. The setup keeps its backlight, needle and syringe components but the smartphone performs both image acquisition and numerical calculation functions.
Traditional Goniometer
Smartphone Based Goniometer
Materials and Setup
To carry out a measurement, you’ll need:
Smartphone with:
A camera that records RAW images at high quality allows users to avoid compression artifacts which affect edge detection accuracy.
Focus and digital zoom.
Accelerometer to detect tilt which enables it to adjust image orientation automatically.
Needle or capillary tube with known diameter (for calibration).
Syringe to dispense a controlled drop (~0.1 mL/min).
Backlight (diffused, placed opposite the smartphone camera).
The Droplet Lab software along with its application allows users to analyze drop shapes and solve Laplace equations.
Optional: Smartphone holder to minimize hand motion.
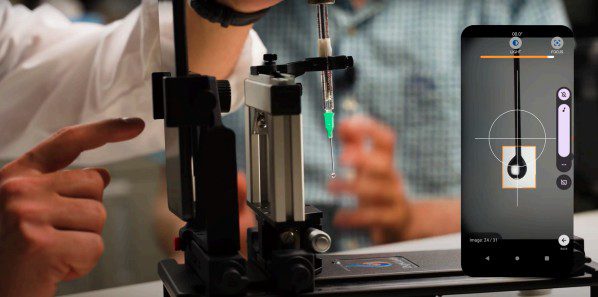
Step 1: Capturing the Drop Image
Form a pendant drop at the needle tip.
Place a diffused backlight behind the drop.
Activate the RAW capture mode on your smartphone camera and record the droplet image.
The accelerometer maintains phone stability through automatic tilt correction which activates when the phone is not level.
Step 2: Detecting the Drop Profile
The application employs Otsu’s thresholding method to identify the shape of the droplet.
This outline becomes the experimental profile.
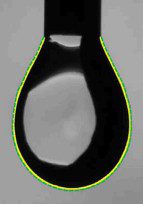
Step 3: Building the Theoretical Profile
We use a numerical solver to resolve the Young Laplace equation
Inputs: density difference (Δρ), gravity (g), initial guesses for γ, drop length, and pressure difference.
The output: a theoretical profile of the droplet.
In the figure, the yellow line is the experimental (Step 2) and the green line is the theoretical (Step 3) drop profile.
Step 4: Matching Experiment and Theory
The algorithm determines the Euclidean distance value which exists between experimental results and theoretical expectations.
It optimises γ, s, and ΔP until the minimum distance is achieved.
That γ is reported as the surface tension.
Step 5: Calibration
The app uses the known needle diameter in the image to calibrate pixel-to-micron scaling.
The device produces results which maintain correct measurement units.
Smartphone-Specific Challenges and Solutions
The absence of scientific camera in smartphones produces various problems for users.
Model Variability – Different CPUs and RAM and camera sensor models create variations in the processing speed and image quality of the system.
Digital zoom artifacts – Unlike optical zoom, digital zoom interpolates pixels, which can reduce edge precision.
Tilt Errors – Users hold their phones at an angle which produces tilt errors because most people do not maintain perfect phone alignment.
The team at Droplet Lab developed these solutions to address above issues:
Accelerometer-based tilt correction.
The system employs Otsu’s algorithm to perform its image processing procedures.
Calibration using the known needle diameter.
An in-built Smartphone holder
The system operates independently from different phone models because of these design decisions.
Computation Speed
Heavy computational tasks would slow down operations if someone expected to transfer them to a mobile device. The reality shows the exact opposite.
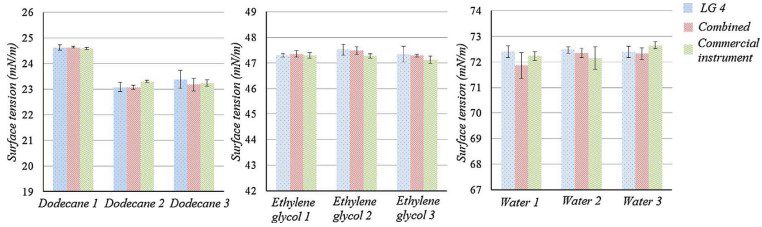
LG G4 (2015 model): 353 ms per measurement.
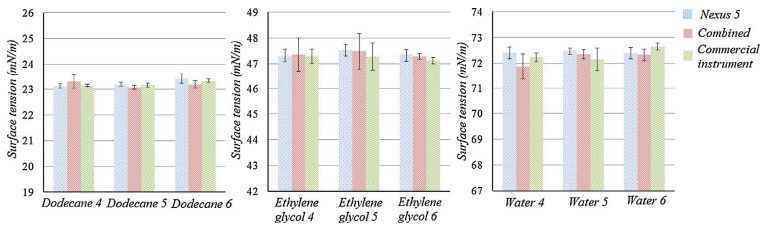
Nexus 5 (2013 model): 705 ms per measurement.
The system operates at a speed which allows it to perform rapid surface tension measurements that last under one second for smartphones which have been in use for ten years.
Combined Measurement Capability
The smartphone method operates independently from the built-in camera functions of the device. Scientists tested the application with images which originated from the Krüss DSA100E tensiometer. The results showed complete agreement between Krüss measurements and smartphone-only measurements.
The program demonstrates image processing capabilities for imported data from different systems which proves its ability to connect with various systems.
Expanded Error Sources
Two main error sources were considered:
Systematic errors (tilt offset). The system achieved an average error rate of 0.357% while operating at a 0.5° tilt which the accelerometer data managed to fix.
Random errors (pixel shifts). Simulated shifts of ±5–50 μm (up to 5 pixels).
The system showed an average error value of −0.168 ± 0.826% at ±50 μm.
Random noise cancels out, preserving accuracy.
The results demonstrate that the method functions successfully when testing with actual imperfect conditions which include user errors and digital image distortions.
Table 1: Error of the surface tension measurement instrument working with the synthetic drop Profiles
Type of Perturbation
Average e (%)
Median e (%)
Maximum e (%)
Ideal image
0.001 ± 0.006
0.000
0.141
0.5° rotation
0.357 ± 0.231
0.377
1.388
−5 μm shift
−0.003 ± 0.102
0.002
0.285
+5 μm shift
0.266 ± 0.105
0.258
0.646
−10 μm shift
0.822 ± 0.188
0.832
1.342
+10 μm shift
1.654 ± 0.346
1.709
2.450
−15 μm shift
0.111 ± 1.327
−0.412
4.841
+15 μm shift
0.273 ± 0.182
0.233
0.979
−20 μm shift
0.940 ± 0.310
0.855
2.213
+20 μm shift
2.057 ± 0.545
1.928
3.971
−50 μm shift
2.965 ± 0.899
3.043
5.692
+50 μm shift
4.663 ± 2.258
4.082
15.204
±5 μm shift
−0.124 ± 0.139
−0.120
0.540
±10 μm shift
−0.135 ± 0.200
−0.138
1.661
±15 μm shift
−0.124 ± 0.265
−0.113
1.010
±20 μm shift
−0.142 ± 0.342
−0.129
4.370
±50 μm shift
−0.168 ± 0.826
−0.200
4.370
Success Parameters: Accuracy and Validation
The system’s performance benchmarks are central to its credibility:
Synthetic profiles (750 drops): 0.001% error.
The system achieves an error rate below 0.5% through its accelerometer-based tilt correction function.
The system maintains its error rate below 1% when the pixel shifts by up to ±50 μm.
Commercial comparison: Results nearly identical to Krüss DSA100E, independent of phone model.
Conclusion
Droplet Lab’s smartphone-based tensiometer doesn’t remove the need for careful experimental setup—it still requires a syringe, needle, and backlight. But by replacing the camera and computer with a smartphone, we’ve created a compact, low-cost system that delivers accuracy on par with industry-standard tensiometers.
The system proves itself through its 0.001% accuracy with synthetic drops, less than 1% error under tilt and pixel noise conditions, fast computation times (<1 sec) and validation against Krüss DSA100E measurements which makes it a reliable portable solution for scientists and educators and industrial users.