Dropometer Photo
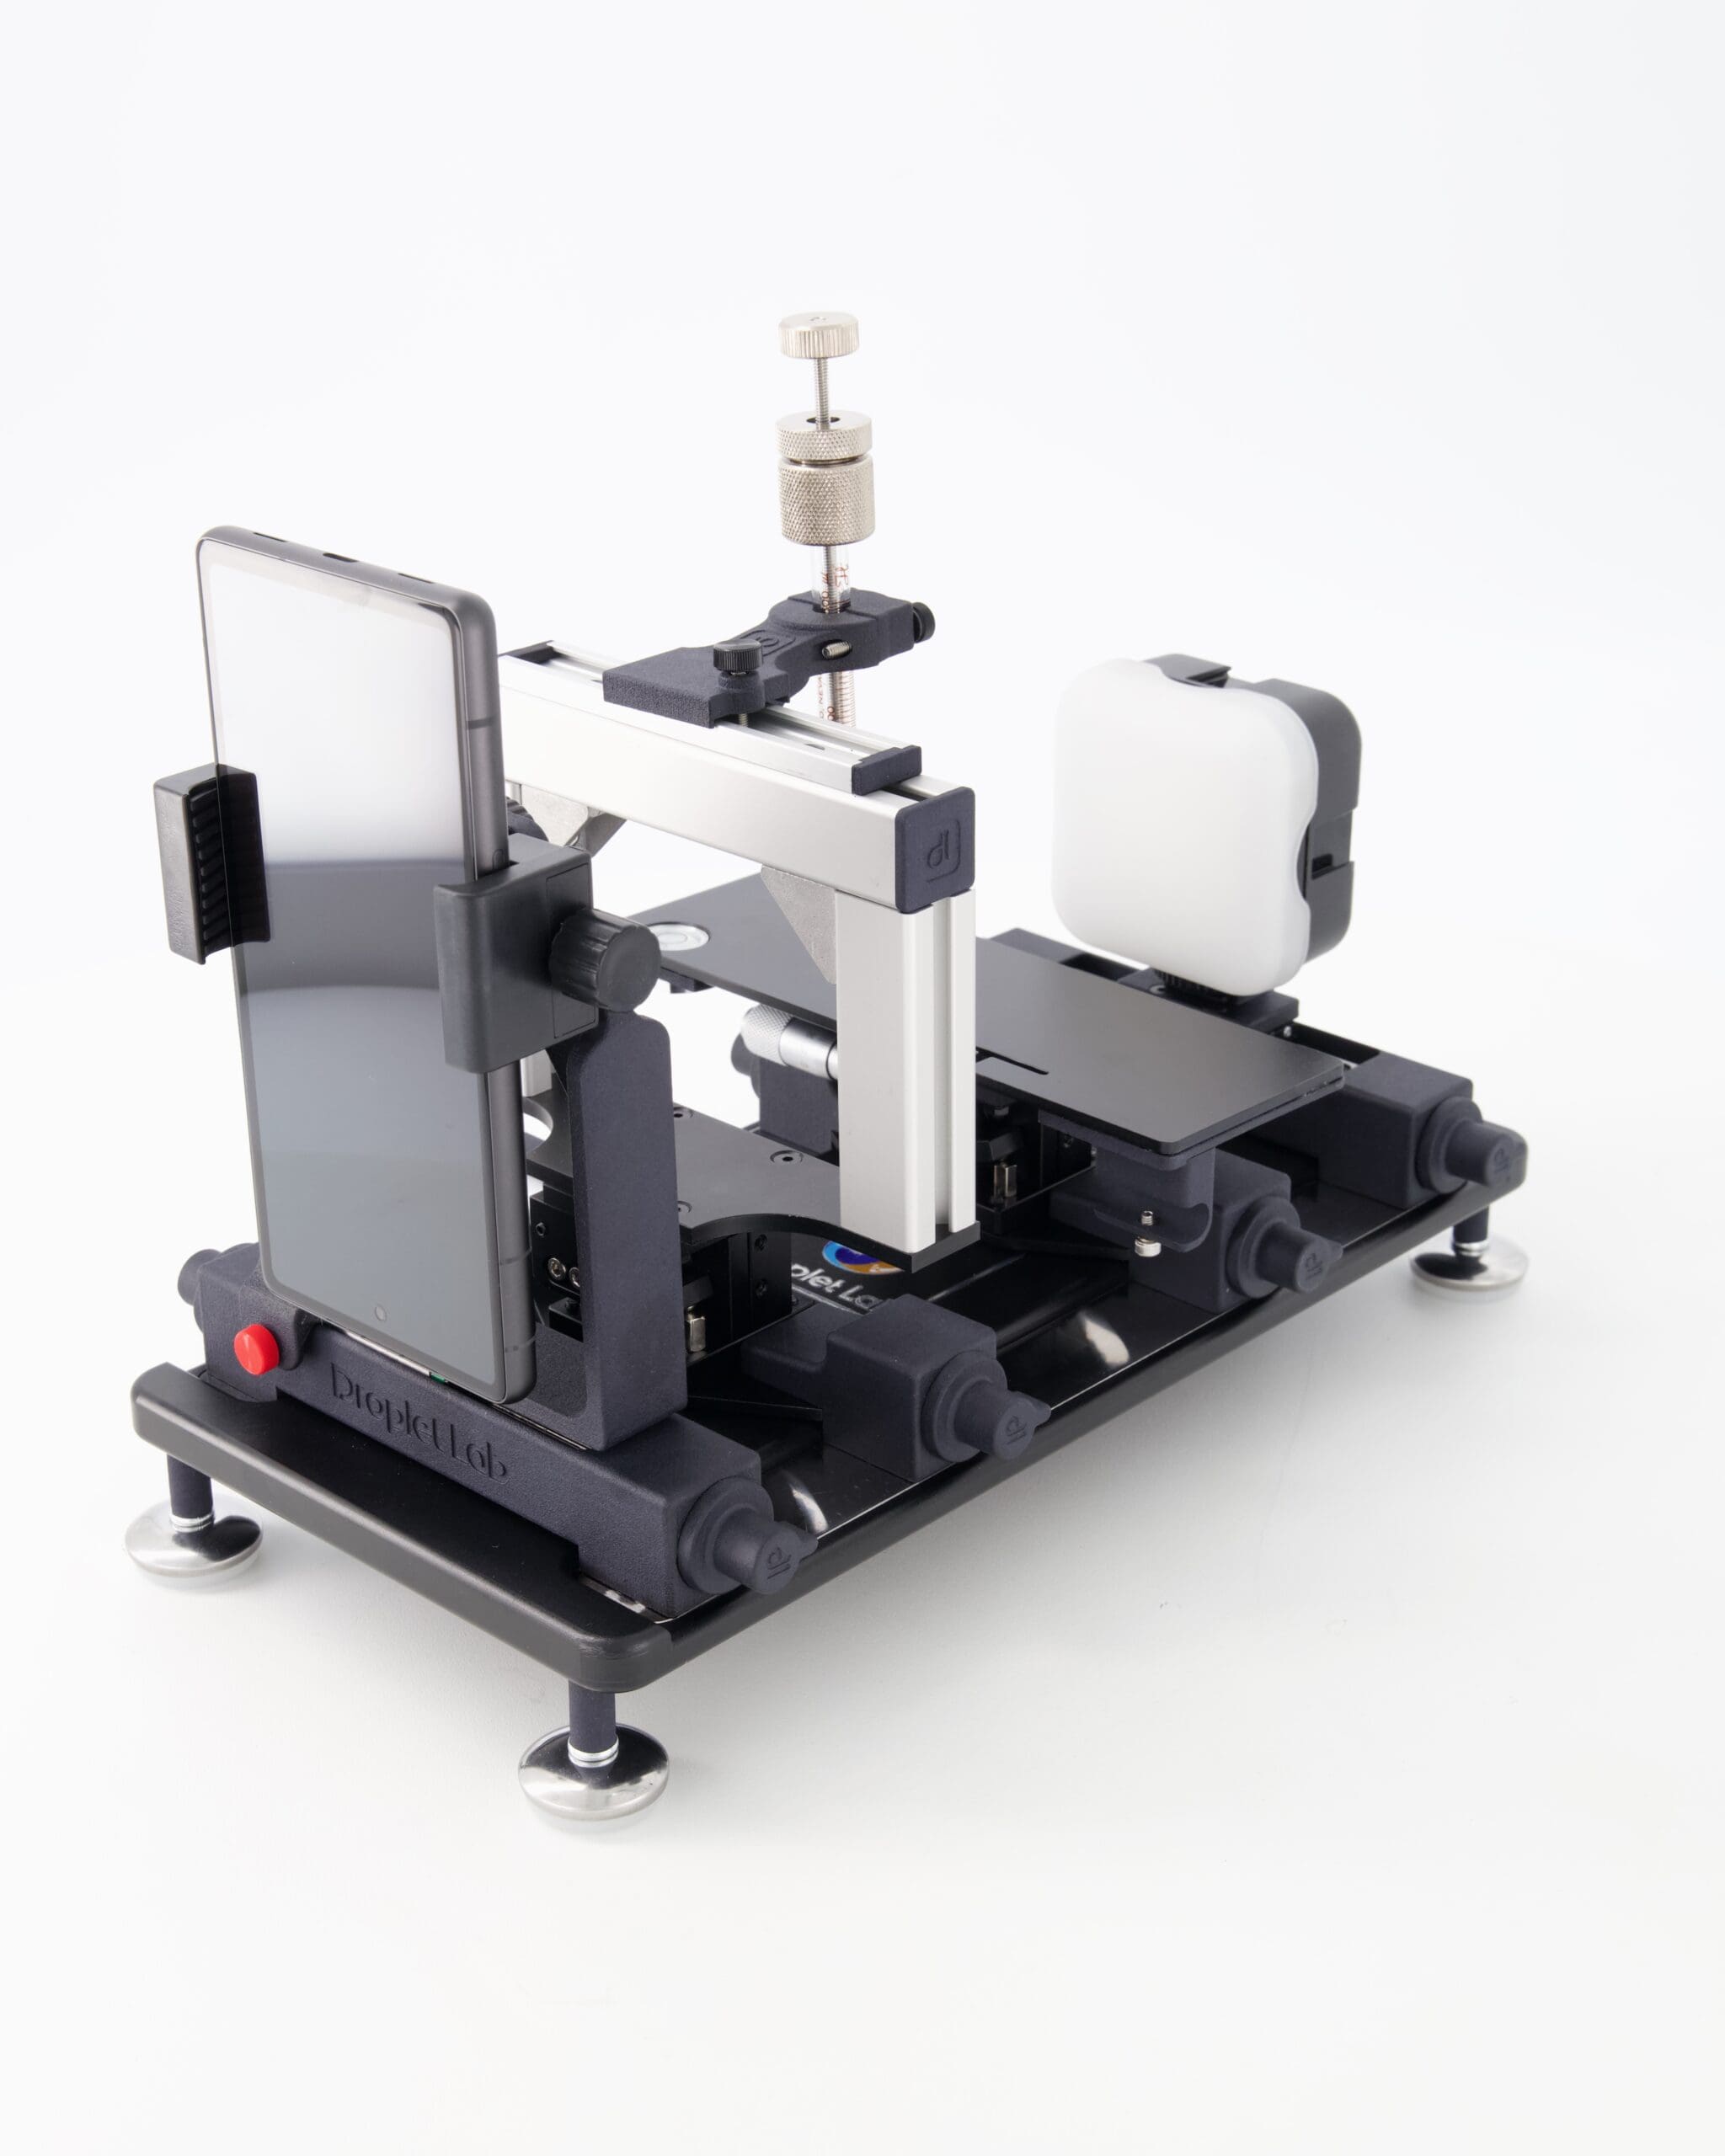
Fig. 1 — Dropometer measurement station (no integrated UV source; exposure is operator-controlled).
What brings you here?
Your path · QC throughput
Your priority is faster, more consistent measurement. Start with how Dropometer slots into the test sequence and what it replaces — about 1.1 minutes per test point, with automated fitting and reporting.
Your path · Audit-ready data
Your priority is data that survives external review. Start with the independent validation — KRÜSS DSA100E benchmark and Gage R&R — and the calibration controls your QMS needs to rely on the measurement.
Your path · Production losses
Your priority is reducing the cost of measurement-related compliance events. Model your own exposure — failed audits, customer rejections, recall risk — then size the payback.
Free download, no account required. A one-page protocol card your team can use directly in QC: operator steps, setup checklist, and reporting fields, formatted for lab use.
Talk to an expert - no commitment
Bring your current setup, sampling plan, and the measurement step you are trying to standardise. We will tell you where Dropometer fits, where it does not, and what a defensible workflow looks like for your samples.
Droplet Lab builds precision instruments and software for surface science measurement, specialising in contact angle analysis and surface tension characterisation. Used by researchers across materials science, pharmaceuticals, coatings, and advanced manufacturing, Droplet Lab's Dropometer has contributed to studies published in peer-reviewed journals including Advanced Functional Materials (Impact Factor 19). The team combines instrument engineering with deep domain knowledge in wettability science with a focus on practical accuracy.
This ISO standard specifies a test method for self-cleaning performance of semiconducting photocatalytic materials, using water contact angle as an index measured under UV illumination. It targets materials containing a photocatalyst or photocatalytic films; commonly semiconducting metal oxides such as titanium dioxide.
Dropometer standardises image capture, baseline detection, and automated reporting for the contact-angle timepoints defined in your ISO test sequence. It has no built-in UV lamp or chamber; the exposure and handling sequence remains an operator-controlled, SOP-validated process.
Acceptance criteria are site‑specific, establish them with reference samples and controlled challenge modes, and document the rationale. Re‑validate after changes to the UV setup, coating chemistry, fixtures, or handling environment.
Use sessile‑drop geometry on smooth, non‑porous surfaces with controlled reagent water, consistent droplet volume, and consistent timing per your validated method. Follow the current ISO revision used by your lab for the exact sequencing, light dose, and sample handling parameters.
The method does not include water-permeable substrates, rough surfaces that do not retain exposed water droplets, highly hydrophobic or superhydrophobic coatings, powder or granular materials, or visible light-sensitive photocatalysts.
The method behind the standard assesses how a water droplet spreads as the surface approaches a superhydrophilic wetting state during UV exposure by tracking θ over time. Dropometer enables high-precision water contact angle measurements at the required timepoints so teams can compare lots, trend drift, and separate coating issues from test-setup variability.
ISO 10678 tests photocatalytic activity via methylene blue degradation in aqueous medium; conceptually different from this standard's wetting-response metric. Separate standards cover air purification, antibacterial activity, and gas-phase removal. Do not substitute these into a report for this method.
"Contact angle only" is a partial match: Dropometer supplies the angle measurement, but not the UV delivery, environmental conditioning, or soiling procedure that your SOP may include.
If your team is spending significant time per sample on manual image capture, angle estimation, and disconnected documentation, that time compounds across every lot. The Dropometer measurement step takes approximately 1.1 minutes per test point — dispense, capture, automated fit, export — leaving your operators focused on the UV sequence and handling protocol rather than data administration. The steps below show exactly where Dropometer slots into an ISO 27448 workflow and what it replaces.
Droplet Lab instrument workflow
Replaces manual estimation and offline calculation
No post-session data entry required
Fig. 1 — Dropometer measurement station (no integrated UV source; exposure is operator-controlled).
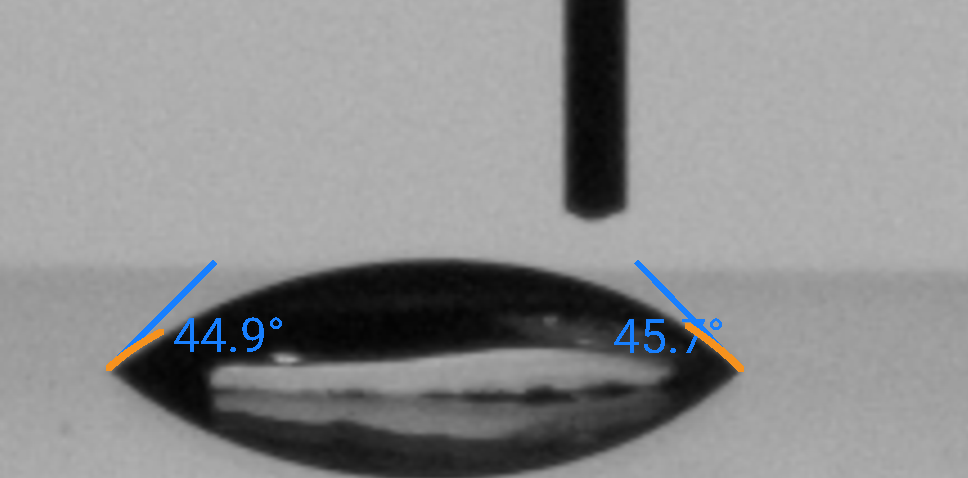
Fig. 2 — Sessile-drop contact angle capture on a coated surface.
Use case: Establish starting θ and measurement repeatability before the UV sequence.
Use case: Quantify the rate and extent of the hydrophilic shift under the validated UV setup.
Use case: Evaluate self-cleaning materials under a controlled, relevant soil challenge and separate process drift from test noise.
Independent benchmarking and publication-based validation references.
A wetting measurement is only defensible if the instrument producing it has been independently validated and if the data trail — lot, operator, instrument, timestamp — is generated at the point of measurement, not reconstructed afterward. The validation references below cover both instrument accuracy (benchmarked against KRÜSS DSA100E, a recognised reference instrument) and measurement system capability (Gage R&R). The calibration section that follows defines the ongoing controls your QMS needs to rely on this data during an external review.
Benchmark Validation
Our contact angle and pendant-drop surface tension methods have been benchmarked against KRUSS DSA100E reference measurements.
Publication Evidence
Our instruments are referenced in peer-reviewed journals, theses, and conference publications.
The Dropometer passed a full Gage R&R study with repeatability and reproducibility within our acceptance criteria, which let us integrate it into our production QC workflow for surface wetting characterisation.
QC Manager, Zeus Inc · polymer extrusion materials manufacturer
For QA teams building or maintaining a QMS entry for contact angle measurement, these four controls form the minimum defensible implementation:
Interpretation anchor: emphasize the shape and repeatability of θ(t) under the validated UV setup, not generic cutoffs.
| Gate | Interpretation (site-defined) | θ (baseline) | θ after UV at | Time-to-threshold | Replicate spread | Notes | What to do |
|---|---|---|---|---|---|---|---|
| PASS | Matches validated reference response | ___° | ≤ ___° | ≤ ___ | ≤ ___° | Uniform across zones | Release / report result |
| MONITOR | Slower or less complete shift | ___° | °–° | – | °–° | Mild zone dependence | Investigate + re-test |
| FAIL | Does not achieve required response | ___° | ≥ ___° | Not reached / ≥ ___ | ≥ ___° or hotspots | Strong nonuniformity | Hold lot; corrective action |
The cost of a measurement problem is rarely the measurement itself. It is the batch held pending re-test, the corrective-action report, the customer rejection when a lot ships against data that later can't be defended, the certification review that stalls when an auditor can't trace a release decision — and, at the extreme, a recall. If you have an external audit, customer qualification, or certification renewal on the calendar, non-defensible wetting data is an exposure you are carrying right now. Dropometer's zone tagging, reference-coupon trending, and time-series output shorten the triage loop and produce records that survive review — and the calculator below lets you model what that exposure reduction is worth using your own cost inputs.
| Metric | Before Dropometer | With Dropometer | Results |
|---|---|---|---|
| Test consistency | Manual capture and variable reporting | Standardized capture + automated reporting | Fewer repeat tests from operator-to-operator variation |
| Drift detection | UV/handling drift found late | Reference coupon trending highlights drift early | Earlier warning prevents bad-batch release decisions |
| Root cause speed | Coating vs UV vs handling unclear | Time‑series + zone tagging accelerates triage | Faster corrective action reduces production hold time |
| Documentation | Disconnected notes and images | Traceable, audit‑ready records (lot/tool/operator/time) | Audit preparation time reduced; records defensible on first request |
Request a quote for your configuration, or talk it through with an application scientist first.
Photocatalytic Self-Cleaning ROI Snapshot
Result
Total annual benefit = scrap savings + labor savings + audit-risk savings.
Goal: Repeatable determination of photocatalytic wetting‑response performance on coated surfaces by static contact‑angle testing, aligned with the ISO standard revision used by your lab.
| Parameter | Recommended Setting | Technical Rationale |
|---|---|---|
| Standard | the standard (confirm revision in your QMS) | Defines a performance index via contact angle tracked under UV. |
| Geometry | Sessile drop | Repeatable for static contact angles on smooth films. |
| Test liquid | Reagent water (site SOP, controlled purity) | Impurities bias wetting and mask surface changes. |
| UV exposure apparatus | External UV setup; document irradiance and geometry | Required for the method; not provided by the measurement instrument. |
| Environment | Site-defined temperature/humidity/airflow control | Reduces drift during timed measurements. |
| Surface suitability | Smooth, non‑porous; avoid texture‑dominated wetting | Improves interpretability and sensitivity to chemistry. |
| Replicates | Multiple per zone (site-defined) | Supports statistics and reveals nonuniform response. |
| Reporting | θ(t) trend + derived index + replicate spread | Captures rate, extent, and uniformity. |
Start: θ does not decrease as expected under UV, time‑to‑threshold increases, or replicate spread widens.
Reference coupon and test samples shift together; large day‑to‑day variability.
Verify irradiance, alignment, warm‑up, and exposure geometry, confirm the timing record and radiometer calibration.
Blanks behave normally but photocatalytic samples respond weakly; strong lot dependence.
Review coating process window, contamination control, and any pre‑activation steps; check material changes that can increase charge‑carrier losses or alter surface chemistry.
Hotspots, strong zone dependence, inconsistent repeat tests.
Repeat with controlled handling and compare to a no‑touch control stored identically.
This page summarizes how Dropometer can support workflows aligned with the standard for contact‑angle‑based performance assessment. It does not reproduce copyrighted standard text, does not confer certification, and does not provide the UV exposure apparatus. Always purchase and follow the official standard revision used by your organization and establish site‑specific acceptance criteria through validated studies.
Editorial and technical transparency notes for this page.
An initial draft was created with AI assistance (ChatGPT 5.2 Pro and Claude 4.8 Opus).
Reviewed and edited for technical accuracy by Droplet Lab Team.
Standard identifiers, units, thresholds, and key procedural claims are checked against cited sources before publication
Reviewed every 12 months or when the underlying standard changes.
Spotted an issue in this summary? Send a correction request and our team will review it.
Correction Request
We work hard to keep this standards summary accurate and up to date. If you spot an error (wrong revision/year, missing requirement, incorrect interpretation, or broken link), tell us and we'll review it.
Contact us to report a correction