Primary surface measurement reported
Pendant-drop surface tension of NCC dispersion and surfactant–NCC mixtures was measured over a surfactant concentration range of 0–500 ppm.
Client Citation Analysis
Pendant-drop surface tension of NCC dispersion and surfactant–NCC mixtures was measured over a surfactant concentration range of 0–500 ppm.
Surface tension was measured using the pendant drop method with a “smartphone-based pendant drop tensiometer manufactured by Droplet Lab, Markham, ON, Canada,” with drop-shape analysis based on fitting the droplet profile with the Young–Laplace equation.
Surface tension trends were compared across Stepanol–NCC and HTAB–NCC mixtures as surfactant concentration increased, and interpreted alongside conductivity and rheology. The authors describe a clear break point around 300 ppm in the HTAB–NCC surface-tension plot.
The measurement for each fluid was performed 30 times and an average value was calculated.
Surface tension of NCC dispersion and surfactant–NCC mixtures was measured by the pendant drop method across surfactant concentration increments of 50 ppm over the range 0–500 ppm.
Electrical conductivity and steady-shear rheology were measured to track surfactant-dependent changes in bulk properties alongside the surface-tension response. Dynamic light scattering (DLS) was used to determine the size distribution of cellulose nanocrystals.
smartphone-based pendant drop tensiometer manufactured by Droplet Lab, Markham, ON, Canada
Thermo Orion 3 Star conductivity meter (Thermo Fischer Scientific Inc., Beverly, MA, USA)
Fann co-axial cylinder viscometer
Zetasizer Nano ZS90 instrument manufactured by Malvern Instruments Ltd. (Zetasizer 6.20 software)
variable-speed Gifford-Wood homogenizer (Model 1-L)
The Dropometer is cited in the methods as a “smartphone-based pendant drop tensiometer manufactured by Droplet Lab, Markham, ON, Canada” used for pendant-drop surface tension. A pendant droplet of the aqueous phase (NCC or surfactant–NCC mixture) was generated at the tip of a stainless-steel needle (1.8 mm diameter) connected to a 500 µL Hamilton® gastight syringe (Model 1750 TPLT), dispensed using a screw-driven plunger; the droplet was imaged using a smartphone camera and analyzed with specialized software. Surface tension was calculated numerically from drop-shape analysis by fitting the droplet profile with the Young–Laplace equation.
The resulting surface-tension curves were used to compare how Stepanol versus HTAB changes interfacial behavior with concentration, and to interpret concentration regions associated with changes observed in conductivity and rheology.
The authors report that surface tension decreases as surfactant concentration increases, as shown in the surface-tension plots for Stepanol–NCC and HTAB–NCC mixtures.
A clear break point is described for the HTAB–NCC surface-tension plot around 300 ppm surfactant concentration. The authors state that surface tension rises at 300 ppm, indicating surfactant migration to the surface of the cellulose nanocrystals.
For Stepanol–NCC mixtures, the surface-tension versus concentration plot shows no break point over the tested range.
The conductivity of HTAB–NCC mixtures increases linearly up to about 350 ppm HTAB and then shows a change in slope; the authors link the slower conductivity increase above this point to surfactant molecules migrating to the nanocrystal surface and charge neutralization.
In the conclusions, the authors state that conductivity and surface tension plots clearly exhibit break points around the HTAB surfactant concentration of 300 ppm in agreement with changes in rheological properties.
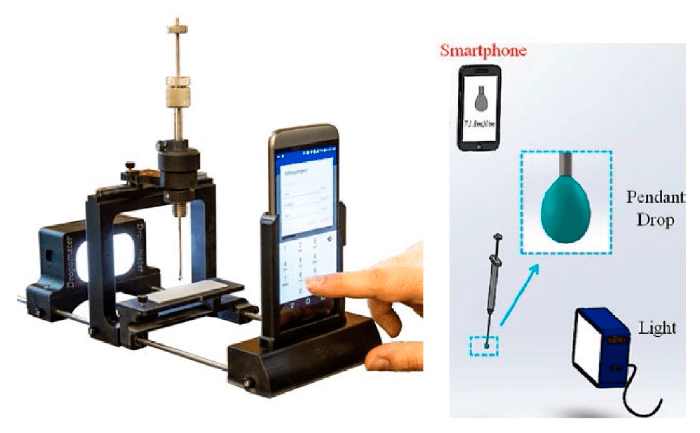
Shows the smartphone-based pendant drop tensiometer used for the pendant-drop surface-tension measurements.
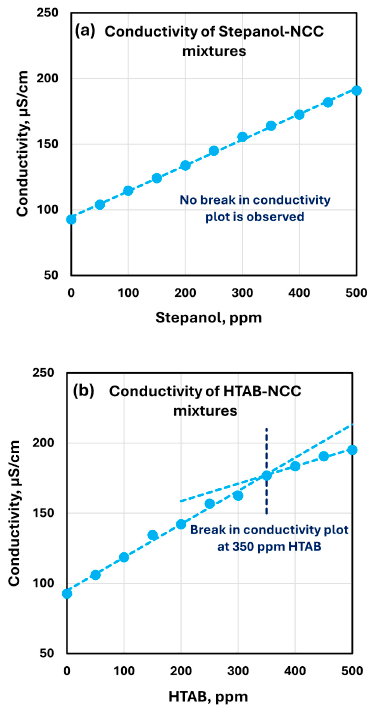
Shows conductivity versus surfactant concentration for Stepanol–NCC and HTAB–NCC mixtures, including the HTAB slope change around 350 ppm.
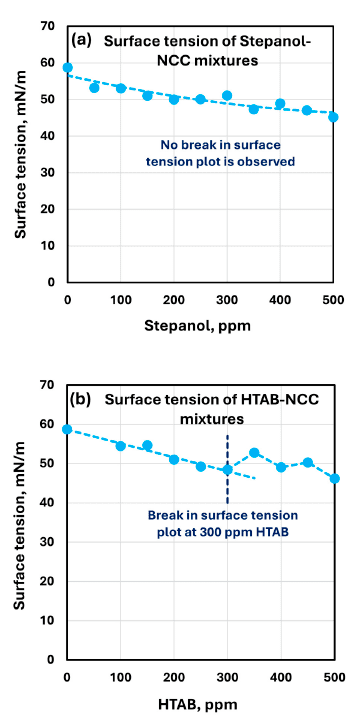
Shows surface tension versus surfactant concentration for Stepanol–NCC and HTAB–NCC mixtures, including the HTAB break point around 300 ppm.
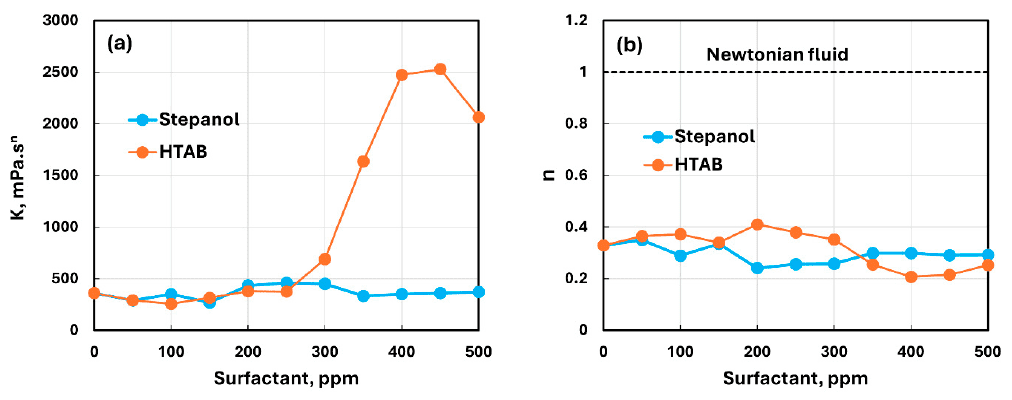
Compares consistency index K and flow behavior index n for Stepanol–NCC and HTAB–NCC mixtures to support interpretation of concentration-dependent changes.
The paper frames NCC as a rheology modifier used across a wide range of formulations and notes that many commercial products combine thickeners and surfactants, motivating the need to understand additive interactions in aqueous systems. Within this study, surface tension and conductivity measurements are described as being carried out simultaneously to track how surfactant addition influences NCC suspensions.
In the results and conclusions, the pendant-drop surface-tension curves help distinguish the Stepanol system from the HTAB system that exhibits a clear transition around 300 ppm. That interfacial transition is discussed as consistent with conductivity and rheology changes and interpreted in terms of surfactant migration to the nanocrystal surface and charge-neutralization effects.
The surface-tension curves provide a direct side-by-side view of Stepanol–NCC and HTAB–NCC behavior over 0–500 ppm.
The paper highlights a clear surface-tension break point around 300 ppm in HTAB–NCC mixtures, discussed alongside strong changes in rheology and a conductivity slope change.
The authors interpret surface-tension behavior together with conductivity trends (Figure 14) to discuss surfactant migration and charge neutralization.
The paper cites a cmc for pure HTAB solutions (0.91 mM, corresponding to 332 ppm) to contextualize where pronounced changes occur in HTAB–NCC mixtures.
The pendant-drop surface-tension measurement for each fluid was performed 30 times and an average value was calculated.