Primary surface measurement reported
Oil–water interfacial surface tension for octane-in-water droplets, reported as 𝑔𝑜𝑤≈10mJ m−2.
Client Citation Analysis
Oil–water interfacial surface tension for octane-in-water droplets, reported as 𝑔𝑜𝑤≈10mJ m−2.
The oil–water interfacial surface tension is reported as
𝑔𝑜𝑤≈10mJ m−2, “as measured by the ‘‘Dropometer’’ from Droplet Labs”.
The reported interfacial surface tension sets the capillary scale used to describe droplet shape restoration and is carried into a quasi-2D framework where an effective 2D surface tension is defined from the experimental 3D value and used to form a dimensionless surface-tension quantity for experiment–simulation comparison. Surface tension is also a central control parameter in the simulations used to interpret speed changes through constrictions and clogging behavior in obstacle arrays.
The error bars for the calibrated DP-model parameters
𝐺∗ and 𝑏0∗ are reported as standard deviations from fitting the DP simulations to at least five independent experimental trials.
Oil–water interfacial surface tension for the octane–water system, reported as 𝑔𝑜𝑤 ≈ 10 mJ m−2 and attributed to measurement by the “‘‘Dropometer’’ from Droplet Labs”.
In the quasi-2D experiments, droplet speed in the driving direction and droplet shape evolution were extracted from microscope videos as droplets moved through a narrow orifice. In the simulation studies, quantities tied to droplet flow and arrest in obstacle arrays (e.g., clogging statistics and mean flow speeds) were evaluated as functions of geometry and a surface-tension-related model parameter.
‘‘Dropometer’’ from Droplet Labs
Leica DM4500 B inverted microscope (with 1.6× lens, 0.05 numerical aperture) + ThorLabs DCC1545M camera (with 0.35× C-mount)
Wixley digital angle gauge
hand-held syringe
The paper reports the oil–water interfacial surface tension as 𝑔𝑜𝑤≈10mJ m−2, “as measured by the ‘‘Dropometer’’ from Droplet Labs,” and uses this value as the surface-tension scale governing droplet capillarity (the tendency for droplets to remain round) during confined, gravity-driven motion. The experimental interfacial tension is then carried into the quasi-2D analysis used to define a dimensionless surface-tension quantity for comparing experimental droplet deformation and speed profiles to the deformable-particle (DP) simulations.
In the study’s workflow, the Dropometer-reported interfacial tension serves as the experimental capillarity input that anchors the surface-tension-based nondimensionalization used alongside the experiment–simulation calibration.
The oil–water interfacial surface tension is reported as
𝑔𝑜𝑤 ≈ 10 mJ m−2, “as measured by the ‘‘Dropometer’’ from Droplet Labs,” and is used to describe why droplets tend to remain round and resist deformation in confinement.
The authors define an effective 2D surface tension from the experimental 3D interfacial tension in the quasi-2D limit and use it to define a dimensionless surface-tension quantity
𝐺𝑒𝑥𝑝 for comparison between experiments and simulations.
The DP simulations are calibrated against experiments of a single droplet flowing through narrow channels by tuning a dimensionless line tension 𝐺 and a near-wall drag coefficient ratio 𝑏0/𝑏𝑁 to minimize deviations in droplet speed (and comparing shape in parallel). For one calibration case, the paper reports
𝐺∗=0.16±0.01 and 𝑏0∗/𝑏𝑁=0.064±0.003
The paper reports a nonmonotonic droplet speed profile as the droplet exits the narrow orifice, including cases where the droplet speed exceeds the terminal speed far from the constriction, with overshoot behavior discussed in terms of the balance between capillarity and driving.
In obstacle arrays, the paper reports that the clogging probability becomes nonmonotonic with surface tension
𝐺: at large 𝐺 droplets are nearly rigid and clogging is high, clogging decreases as 𝐺 decreases and droplets become more deformable, and clogging increases again at small 𝐺 where highly deformable droplets can wrap around obstacles.
The authors state that varying surface tension in the experiments by more than a factor of 2 is challenging, and they therefore carry out simulations with surface tensions varying by more than a factor of
10^3 to accentuate wrapping behavior.
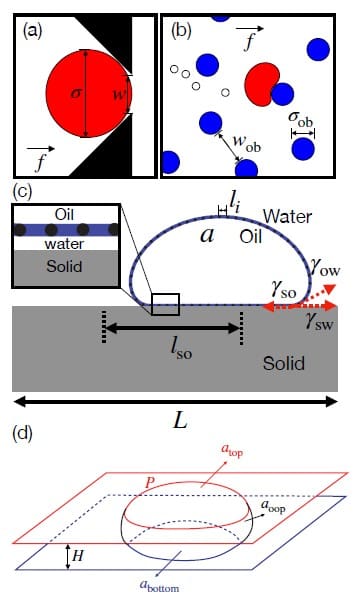
Shows the geometric decomposition of surface area (including the out-of-plane area term) used to motivate the quasi-2D surface-tension treatment that connects experimental interfacial tension to the 2D modeling framework.
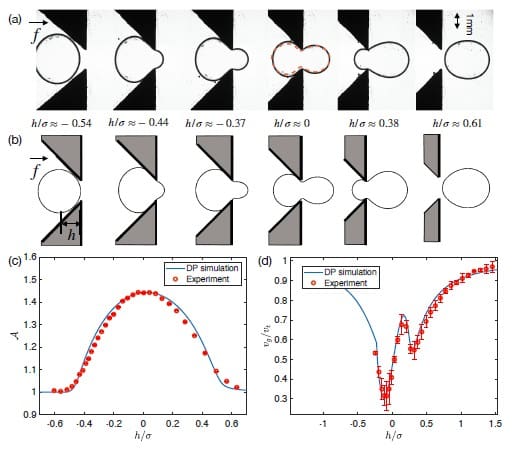
Presents experimental and DP-simulation droplet shapes and speeds through a narrow orifice and reports fitted DP parameters, along with an estimated 𝐺𝑒𝑥𝑝 for the experimental condition.
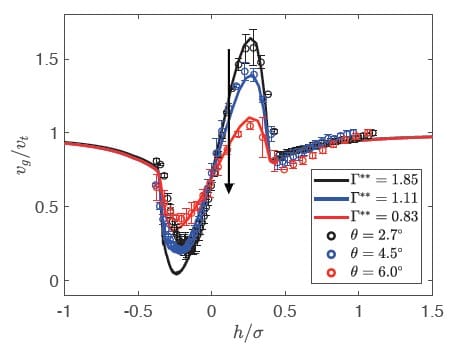
Plots 𝑣𝑔/𝑣𝑡 versus position relative to the orifice for several tilt angles, showing overshoot behavior and reporting fitted line tensions 𝐺∗∗ for the calibrated DP simulations.
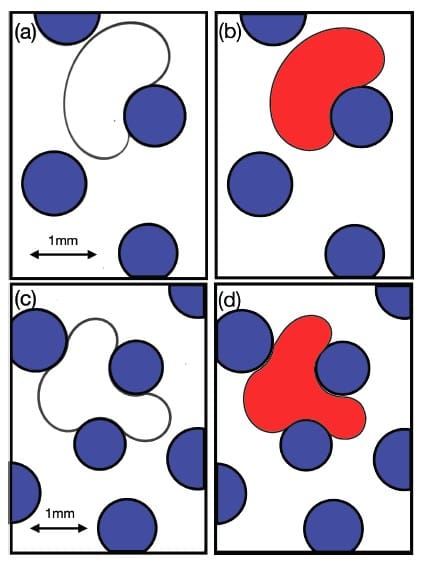
Shows experimental images and calibrated DP simulations illustrating wrapping and squeezing, with the experimental caption reporting 𝐺𝑒𝑥𝑝 for the example obstacle-array condition.
This paper frames surface tension as the capillary property that governs droplet deformability in confined geometries, shaping how droplets slow down, deform, and either pass through or arrest in constrictions and obstacle arrays. The reported oil–water interfacial tension (measured with the ‘‘Dropometer’’) anchors the experimental capillarity scale that is then carried into a quasi-2D, dimensionless description used for experiment–simulation comparison.
By connecting capillarity-controlled deformation to two distinct obstacle-array clogging mechanisms (squeezing versus wrapping) and showing nonmonotonic clogging trends with surface tension, the study supports a more predictive understanding of droplet transport through complex microfluidic-like geometries.
The study uses 𝑔𝑜𝑤≈10 mJ m−2 (measured by the ‘‘Dropometer’’) as the interfacial-tension input that underpins the capillarity arguments and the quasi-2D surface-tension scaling used throughout the analysis.
The paper defines a dimensionless experimental surface-tension quantity 𝐺𝑒𝑥𝑝 from the experimental interfacial tension and uses it in the context of comparing measured droplet shape/speed to DP simulations.
The reported speed profile through a narrow orifice is nonmonotonic and can exceed the terminal speed after the droplet exits the constriction, with the behavior discussed in terms of capillary versus driving effects.
The paper reports that very deformable droplets can wrap around obstacles, which decreases average speed in continuous-flow studies and contributes to increased clogging probability in the permanent-clog regime.
For obstacle arrays, the paper states that permanent clogs can form when wob / σ < 1, and it reports continuous-flow results for example gap ratios 𝑤𝑜𝑏/𝜎=1.0–1.3