Primary surface measurement reported
Surface tension of surfactant solutions and surfactant–polymer solutions, measured across CHEC concentrations of 1000–4000 ppm and surfactant concentrations of 0–500 ppm.
Client Citation Analysis
Surface tension of surfactant solutions and surfactant–polymer solutions, measured across CHEC concentrations of 1000–4000 ppm and surfactant concentrations of 0–500 ppm.
The paper attributes surface-tension measurements to a “pendant drop tensiometer” manufactured by Droplet Lab, Markham, ON, Canada, with droplet profiles fit to the Young–Laplace equation.
The surface-tension data were used to compare pure polymer, pure surfactant, and polymer–surfactant mixtures, to locate minima versus surfactant concentration, and to track how those minima shifted as polymer concentration increased. The paper also compares the surface-tension minima with maxima in consistency index to interpret coupled changes in surface activity and rheology.
Surface tension was measured twelve times for each fluid and averaged; for the 2000 ppm CHEC series, the paper reports small standard deviations across the surfactant concentration sweep.
4.0
0.432
1.8
1.9
Q3 - Physics, Fluids & Plasmas (24/40)
Surface tension was measured for surfactant solutions and surfactant–polymer solutions at room temperature using the pendant droplet method. The study uses these measurements as its direct readout of surface activity across the CHEC/Stepwet composition sweep.
Steady rheological properties were measured and described with the power-law model through the consistency index K and the flow behavior index n. Electrical conductivity was also measured to compare ionic changes alongside rheology and surface activity.
For surface-tension measurements, the paper describes a pendant drop tensiometer manufactured by Droplet Lab, Markham, ON, Canada. A pendant droplet was generated, imaged at high resolution using a smartphone camera, and analyzed in specialized software by fitting the droplet profile with the Young–Laplace equation to estimate surface tension.
These measurements were used to show how surface activity changed with surfactant concentration, how that response depended on CHEC concentration, and where the surface-tension curves aligned with maxima in consistency index.
For polymer-only CHEC solutions, surface tension was almost independent of polymer concentration and only slightly less than that of water. In the same series, conductivity increased with polymer concentration.
The surface tension of polymer–surfactant mixtures was substantially lower than that of the surfactant solution without polymer. The paper states that, at the same surfactant concentration, this indicates polymer–surfactant complexes were more surface active than surfactant molecules.
At a given polymer concentration, surface tension dropped and passed through a minimum at intermediate surfactant concentration. The paper concludes that this minimum shifted to higher surfactant concentration as polymer concentration increased; for the 2000 ppm CHEC series, Table 3 shows a minimum mean surface tension of 27.058 mN/m at 250 ppm surfactant.
The surface-tension plots were consistent with the rheological data in that the consistency index exhibited a maximum where surface tension was minimum. The consistency-index maximum shifted from 100–200 ppm surfactant at 1000 ppm CHEC to 400–500 ppm surfactant at 4000 ppm CHEC.
At any given surfactant concentration, increasing polymer concentration raised the consistency index and generally lowered the flow behavior index, making the mixtures more shear-thinning. In the same fixed-surfactant comparison, surface tension decreased substantially and conductivity increased with increasing polymer concentration.
Surface tension was measured twelve times per fluid and averaged. For the 2000 ppm CHEC series, the paper reports small variability around the mean across the full surfactant concentration sweep, and Figure 11 shows correspondingly small error bars.
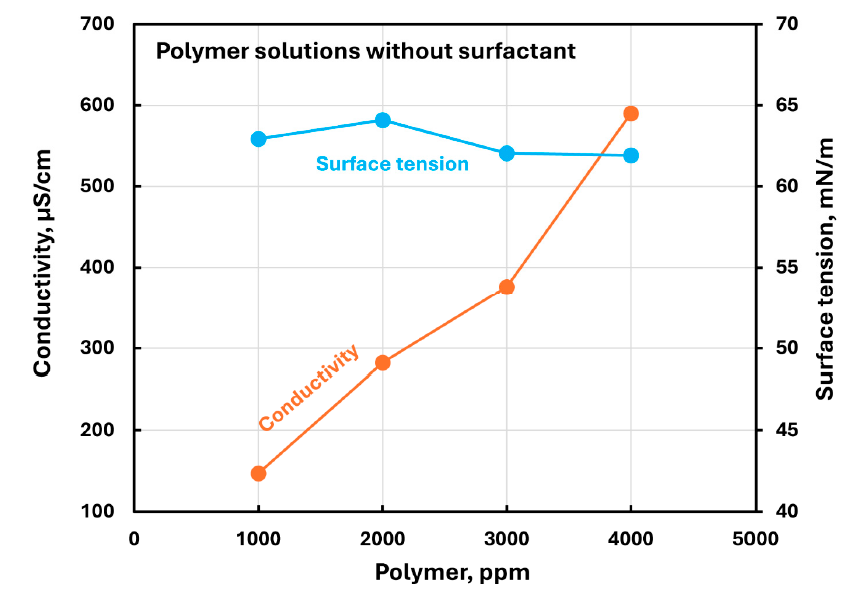
Shows conductivity and surface tension for polymer-only CHEC solutions, establishing that surface tension changes little with polymer concentration before surfactant is added.
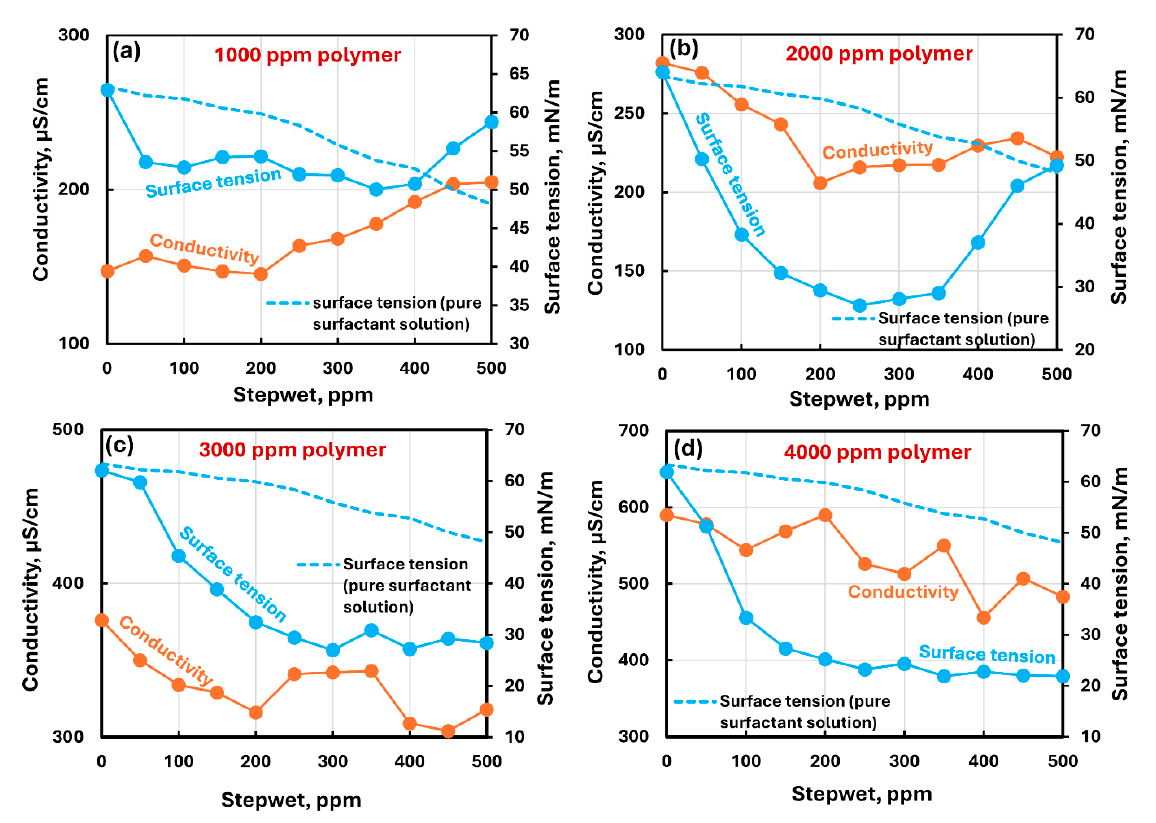
Shows conductivity and surface tension versus surfactant concentration for 1000, 2000, 3000, and 4000 ppm CHEC, alongside the pure surfactant comparison curve.
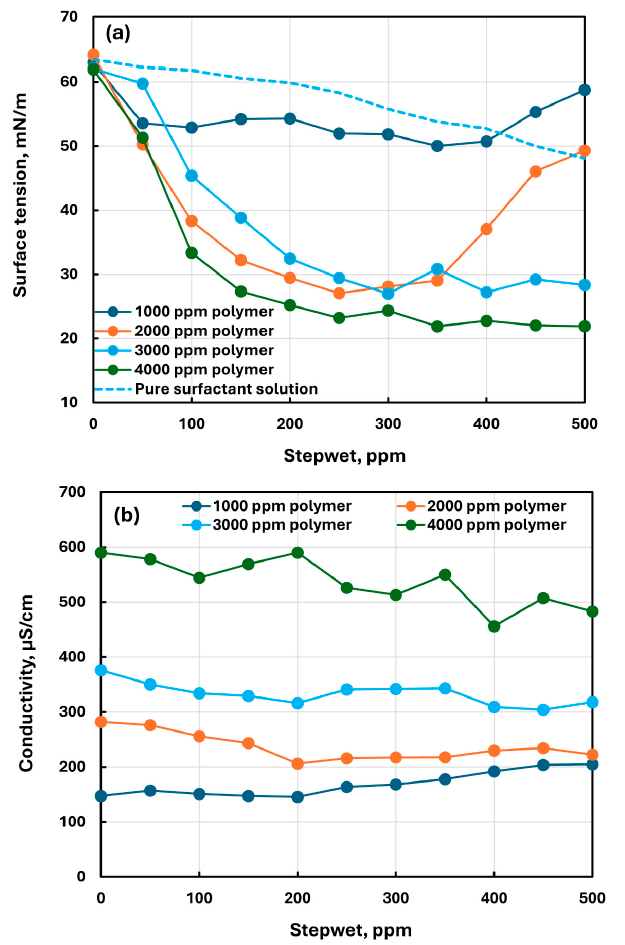
Shows that, at a given surfactant concentration, surface tension decreases substantially as polymer concentration increases.
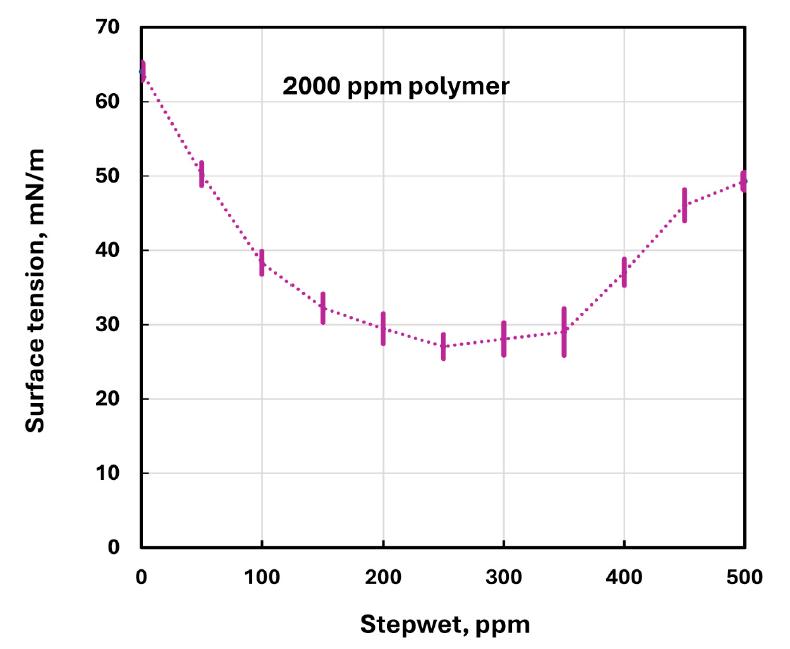
Shows error bars on the 2000 ppm CHEC surface-tension data, matching the mean and standard deviation values reported in Table 3.
The paper frames polymer–surfactant interactions as important to applications such as enhanced oil recovery, hydraulic fracturing and drilling fluids, and formulated products. In that context, surface tension served as the study’s direct measure of surface activity alongside rheology and conductivity.
Here, the pendant-drop data did more than show that mixtures lowered surface tension. They helped locate the composition ranges where behavior changed, showed that the low-surface-tension response moved as CHEC concentration changed, and reinforced the paper’s conclusion that surface-active and rheological changes were linked across the formulation sweep. The authors discuss charge neutralization and entanglement at lower surfactant addition, and recharging and disentanglement at higher surfactant addition, as a possible explanation for these coordinated trends.
In this study, surface-tension minima marked the same composition region where the consistency index reached a maximum.
As CHEC concentration increased from 1000 to 4000 ppm, the response shifted to higher sodium lauryl sulfate concentrations.
The paper used both baselines to show that CHEC alone had little effect on surface tension, while polymer–surfactant mixtures were much more surface active.
The authors used all three measurements to interpret how mixture behavior changed across composition.
Each fluid was measured twelve times for surface tension and averaged, and the 2000 ppm series showed small standard deviations across the sweep.