
Contents
Pre-Bond Surface Activation & QC

Plasma Treatment Verification for Reliable Adhesive Bonding

Confirm plasma or corona surface activation actually took, and hasn't already decayed, before you commit an adhesive bond, so a weak bond from under-treatment or treatment aging gets caught before assembly, not after a failed joint.

Who this is for: Bonding process engineers, assembly QA/QC teams, and plasma or corona treatment equipment operators in automotive, aerospace, medical device, and industrial adhesive bonding.

Positioning: Dropometer does not replace bond-strength testing (lap shear, peel, pull tests). It verifies surface activation, contact angle and surface energy, immediately before bonding, catching an under-treated, unevenly treated, or already-decayed surface before it becomes a bond failure.

Last updated
July 13, 2026
Gurdeep-Saini-Photo
Written by
Gurdeep Singh Saini
Holds a BASc in Mechanical Engineering (Ryerson) and an MASc from York University. He focuses on the custom AI behind the instrument.
COO at Droplet Lab
Read More

Droplet-Lab logo
Technical Review by
Droplet Lab Team
Droplet Lab builds precision instruments and software for surface science measurement, specialising in contact angle analysis and surface tension characterisation. Used by researchers across materials science, pharmaceuticals, coatings, and advanced manufacturing, Droplet Lab's Dropometer has contributed to studies published in peer-reviewed journals including Advanced Functional Materials (Impact Factor 19). The team combines instrument engineering with deep domain knowledge in wettability science with a focus on practical accuracy.

Read More
Gurdeep-Saini-Photo
Written By

Gurdeep Singh Saini

COO at Droplet Lab

Holds a BASc in Mechanical Engineering (Ryerson) and an MASc from York University. He focuses on the custom AI behind the instrument.

Droplet-Lab logo
Reviewed By

Droplet Lab Team

Droplet Lab builds precision instruments and software for surface science measurement, specialising in contact angle analysis and surface tension characterisation. Used by researchers across materials science, pharmaceuticals, coatings, and advanced manufacturing, Droplet Lab's Dropometer has contributed to studies published in peer-reviewed journals including Advanced Functional Materials (Impact Factor 19). The team combines instrument engineering with deep domain knowledge in wettability science with a focus on practical accuracy.


The Cost Of Getting It Wrong

15–20%

of annual revenue consumed by Cost of Poor Quality in typical manufacturing operations

American Society for Quality

10×

higher hidden cost vs. visible scrap cost: rework, re-inspection, downtime, and warranty claims are rarely captured

Lean Six Sigma research consensus

$1 → $10

upstream prevention typically saves $10 in internal rework and up to $100 in external warranty and recall costs, for the specific failure modes an upstream screen actually catches

COPQ prevention-to-failure ratio

Sources: ASQ, Learn Lean Sigma, Fabrico COPQ Guide 2026. Figures are industry-wide benchmarks, not Droplet Lab claims. This instrument verifies surface activation well, contact angle and surface energy directly reflect whether plasma or corona treatment took and whether it's since decayed. It does not verify adhesive cure conditions or joint mechanical design, both are documented bond-failure causes outside this screen's scope.

QC-Ready Summary

What this workflow does and what it does not

Quick technical reference for engineers and QA managers evaluating fit before reading further.

Evidence Box (QC-Ready)

Problem this solves

Adhesive bond failures traced back to inadequate, uneven, or decayed plasma or corona surface activation, invisible to visual inspection and typically discovered only at bond-strength testing or after a field failure.

Dropometer role in workflow

A pre-bond verification tool confirming surface activation level and stability immediately before adhesive application. Not a replacement for bond-strength testing (lap shear, peel, pull tests).

Primary outputs

Contact angle as a direct activation-level indicator
Surface energy trend data for the treated substrate
Spot variability and zone mapping for uneven treatment detection
Time-since-treatment tracking for decay risk

Calibration requirement

Correlate PASS/MONITOR/FAIL thresholds to your own bond-strength test data (lap shear, peel) per substrate, treatment method, and adhesive system, not a generic published value.

Protocol defaults

DI water as the probe liquid
Fixed droplet volume and timepoint
Minimum 5 replicates per zone
Record time elapsed since plasma or corona treatment alongside every reading

Key limitation

Contact angle and surface energy verify surface readiness, they do not measure bond strength, adhesive cure state, or joint mechanical performance directly.

Who this is for

What are you trying to solve?

The Dropometer serves four roles across a plasma treatment verification program. Each has a different primary risk.

Process Engineer (Treatment Consistency)

Fighting inconsistent bond results tied to plasma or corona equipment drift, power, speed, gas flow, and needing a numeric way to confirm the treatment step itself is still working.

Bond failure and rework cost

Assembly Engineer (Decay Window)

Needing to know how long a treated surface stays reliably bondable before hydrophobic recovery erases the activation, especially when treatment and bonding happen on different shifts or stations.

Scheduling and queue-time risk

QA / QC Manager

Needing a numeric pre-bond release gate on treated parts rather than a visual or "time elapsed looks fine" judgment call.

Batch inconsistency cost

Compliance Officer

Requiring documented, defensible evidence of pre-bond surface activation for regulated bonding processes (aerospace, medical device) in NCR responses, CAPA files, or supplier audits.

Audit non-conformance
workflow fit

Is this the right screen for your process?

This is not a universal solution. Check the conditions below before investing further time.

Good fit if

You're seeing bond failures or inconsistent bond strength with no confirmed cause, and want to rule surface activation in or out first
Your treatment and bonding steps happen on different shifts, stations, or with queue time between them, and you need to know your actual decay window
You need a numeric pre-bond release gate on treated parts rather than a visual or elapsed-time-only check
You're qualifying a new substrate, treatment recipe, or adhesive system and want a wetting baseline before committing to bond-strength trials
Your QA or compliance process requires a traceable pre-bond activation record

Less relevant if

Your bond failures are already confirmed to trace back to adhesive cure conditions or joint design rather than surface activation, see Honest Scope for why this instrument doesn't screen for that directly
You need a final bond-strength number for a spec sheet, lap-shear, peel, or pull testing on the actual joint remains the acceptance method
Your treatment-to-bond interval is fixed and short enough that decay isn't a realistic risk, and your process is already stable with no equipment drift history
Your substrate and treatment recipe are already well-characterized with no new materials or process changes to qualify
Root Cause Context

Plasma Treatment Doesn't Fail at the Treatment Step. It Fails at the Clock.

A correctly treated surface can still fail to bond if too much time passes before the adhesive goes on.

Plasma and corona treatment work by introducing polar functional groups onto a polymer surface, raising its surface energy and making it wettable and bondable. That much is well established and widely used across automotive, aerospace, medical device, and industrial bonding. What's less consistently accounted for is that the effect isn't permanent: treated polymer surfaces undergo a well-documented phenomenon called hydrophobic recovery, where surface energy relaxes back toward the untreated state over a period of hours to days, depending on the polymer, the treatment method, and storage conditions.

That means a bond failure investigation that only checks "was the part treated" is asking half the question. The other half is "how much time passed between treatment and bonding, and had the activation already decayed by then." A treatment step that was run correctly, on schedule, at the right power and speed, can still produce a weak bond if the part sat too long before adhesive application.

This workflow measures contact angle and surface energy both immediately after treatment and again just before bonding, so a decayed surface is caught as a decay problem, not misdiagnosed as an equipment problem. The honest limit: this verifies surface activation, it doesn't measure bond strength, adhesive cure, or joint mechanics, all of which need their own acceptance testing downstream.

Recognition

What Does a Plasma Treatment Verification Gap Actually Look Like?

Parts that were treated on schedule still produce inconsistent bond strength, adhesive delamination shortly after assembly, or bond failures that don't correlate cleanly with any single process change, without a quantitative way to tell whether the treatment step, the treatment-to-bond interval, or something else entirely is responsible.

Bond failures or weak bonds with no clear single cause.
Adhesive delamination shortly after assembly, sometimes within the same shift.
Inconsistent bond strength across parts from the same treatment batch.
Failure rate that correlates with queue time or shift changes between treatment and bonding, rather than with the treatment settings themselves.
Failure rate that correlates with plasma or corona equipment maintenance cycles.
Visually identical, identically treated parts producing different bond outcomes.
Diagnosis

Root Causes

Why:

  • Reduced exposure time, power, or gas flow lowers the degree of surface activation achieved during treatment.

How to detect:

  • Contact angle measured immediately after treatment is higher than your known-good baseline

Corrective action:

  • Recalibrate treatment power, line speed, and gas flow against your validated recipe

Why:

  • Plasma and corona-activated polymer surfaces spontaneously revert toward their untreated, higher-contact-angle state over hours to days, a well-documented surface phenomenon, not an equipment malfunction.

How to detect:

  • Contact angle measured just before bonding is meaningfully higher than the angle measured immediately after treatment, even though the treatment step itself checked out fine

Corrective action:

  • Shorten the treatment-to-bond interval, or re-treat any part that has exceeded your measured decay window

Why:

  • Electrode geometry, part fixturing, or nozzle positioning creates zones of lower activation across a single part's surface.

How to detect:

  • High contact-angle variability across measurement zones on the same part

Corrective action:

  • Adjust fixturing or nozzle path, and add zone mapping to the pre-bond release protocol rather than relying on a single spot check

Why:

  • Some polymers, PTFE and certain polyolefins in particular, need different treatment parameters or additional process steps to reach a bondable activation level than a general-purpose recipe provides.

How to detect:

  • Persistently high contact angle despite nominal treatment settings that work fine on other substrates

Corrective action:

  • Qualify treatment parameters per substrate rather than applying one universal recipe across materials

Why:

  • If surface activation measures within baseline but bond strength is still weak, the more likely cause is adhesive cure conditions, exceeded open or working time, dispensing and mixing error, or joint design and loading, none of which this screen measures.

How to detect:

  • Contact angle and surface energy are within baseline while lap-shear or peel results remain poor

Corrective action:

  • Route the investigation to adhesive cure schedule, dispensing and mixing QC, and joint design review rather than continuing to iterate on surface activation alone

Not sure which root cause applies to your process?

A surface science specialist can review your failure history and help you identify whether a surface screen would add a useful upstream gate.

For Compliance Officers and QA Managers

Building a defensible pre-bond inspection record

Surface readiness measurement produces the type of numeric, traceable output that a subjective visual or "it was treated on schedule" assumption cannot. If your quality system requires documented evidence of process control at each stage for NCR responses, CAPA files, incoming inspection records, or supplier audits, contact angle and surface energy data provide that evidence in a format your QA documentation already requires.

Audit trail

Numeric contact angle and surface energy values, with replicate spread, timestamps, and time-since-treatment, on every part or batch; replacing "it was treated" assumptions with defensible numeric logs.

CAPA evidence

When a bond failure triggers a Corrective and Preventive Action file, activation data from immediately after treatment and just before bonding distinguish an equipment-drift cause from a decay-window cause with evidence, not anecdotal description.

NCR documentation

Non-conformance reports that include numeric activation data allow you to assign root cause to treatment dose, decay, uneven coverage, or substrate mismatch with evidence, not inference.

Supplier qualification

Incoming pre-treated substrate or component inspection using contact angle and surface energy provides a numeric acceptance criterion for supplier qualification, independent of the supplier's own certificate of treatment.

Process control records

Contact angle and surface energy trend logs by treatment batch and shift demonstrate statistical process control at the pre-bond step; relevant to Six Sigma, SPC, and DMAIC programs targeting bond-failure-driven COPQ.

Pre-bond release record

A verification check run just before adhesive application gives assembly a numeric basis for proceeding or holding, instead of finding out about a decayed or under-treated surface only after a failed bond.

What to Measure

Primary screen

Contact angle

Why it matters: Direct proxy for the surface-energy increase achieved by plasma or corona treatment.

How to interpret: Lower angle indicates higher activation, correlate against your own lap-shear or peel data to set a real threshold.

When it is not enough: Doesn't measure bond strength, adhesive compatibility, or cure state directly.

Primary screen

Surface energy trend

Why it matters: Quantifies the treatment's effect in terms comparable to an adhesive manufacturer's minimum wetting or surface-energy specification.

How to interpret: Compare against the adhesive's stated minimum requirement, not just a generic "treated vs. untreated" baseline.

When it is not enough: A snapshot reading; needs to be paired with time-since-treatment to be meaningful.

Primary screen

Time-since-treatment / decay tracking

Why it matters: Hydrophobic recovery reduces activation over hours to days; a part bonded outside its validated window can fail even with a correct initial treatment.

How to interpret: Define a maximum treatment-to-bond window from your own measured decay curve, not from a generic published figure.

When it is not enough: Decay rate varies meaningfully by polymer type and treatment method; requires your own correlation data per material.

QC

Spot variability (zone mapping)

Why it matters: Detects uneven treatment coverage across a single part that an average reading would hide.

How to interpret: High variability flags a fixturing, nozzle-path, or electrode-geometry issue worth investigating.

When it is not enough: Flags where a problem exists without confirming which specific equipment cause is responsible.

Validated Measurement Approach

Independent benchmarking and publication-based validation references.

Benchmark Validation

Dropometer contact angle and pendant-drop surface tension methods have been benchmarked against KRÜSS DSA100E reference measurements. The instrument is referenced in peer-reviewed journals including Bioactive Materials (Impact Factor 20) and Advanced Functional Materials (Impact Factor 19).

See peer-reviewed validation

Publication Evidence

Our instruments are referenced in peer-reviewed journals, theses, and conference publications.

Browse citations
QC Protocol

How Dropometer Fits Your Workflow

Dropometer is best used to characterize your own treatment decay window once, then verify against it as a pre-bond release gate on every batch.

1

Establish a treatment baseline

Measure contact angle and surface energy immediately after treatment on a known-good setup: This is the reference point every future reading gets compared against

2

Characterize your decay window

Measure contact angle at multiple time points after treatment to build your own decay curve for each substrate and treatment method: Use the peer-reviewed hydrophobic-recovery literature as a starting expectation, not a substitute for your own data

3

Set a pre-bond release gate

Verify contact angle and surface energy just before adhesive application, within your validated treatment-to-bond window: PASS: within baseline band → release for bonding MONITOR: borderline result → re-verify or expedite bonding FAIL: out of band → re-treat before bonding

4

Troubleshoot a bond failure

Check whether the failure correlates with equipment drift, decay-window overrun, uneven coverage, or a cause outside this screen's scope: Rule out surface activation first, since it's the fastest of the likely causes to check

We completed our gage R&R study on the unit and it performed very well.

Brandon Barbee

Corporate Quality Engineer - Zeus Industries - Polymer Manufacturing

Download the Pre-Bond Plasma Verification SOP Template

An editable SOP template your team can adapt for your substrate, treatment method, and adhesive system. Includes measurement protocol, decay-window characterization guidance, gate-setting guidance, and a QC log format ready for your documentation system.

Example Outputs

Sample Pre-Bond Screening: Treatment Activation and Decay Tracking

Representative output format. Values are illustrative, not a universal specification.

Actual measurement output
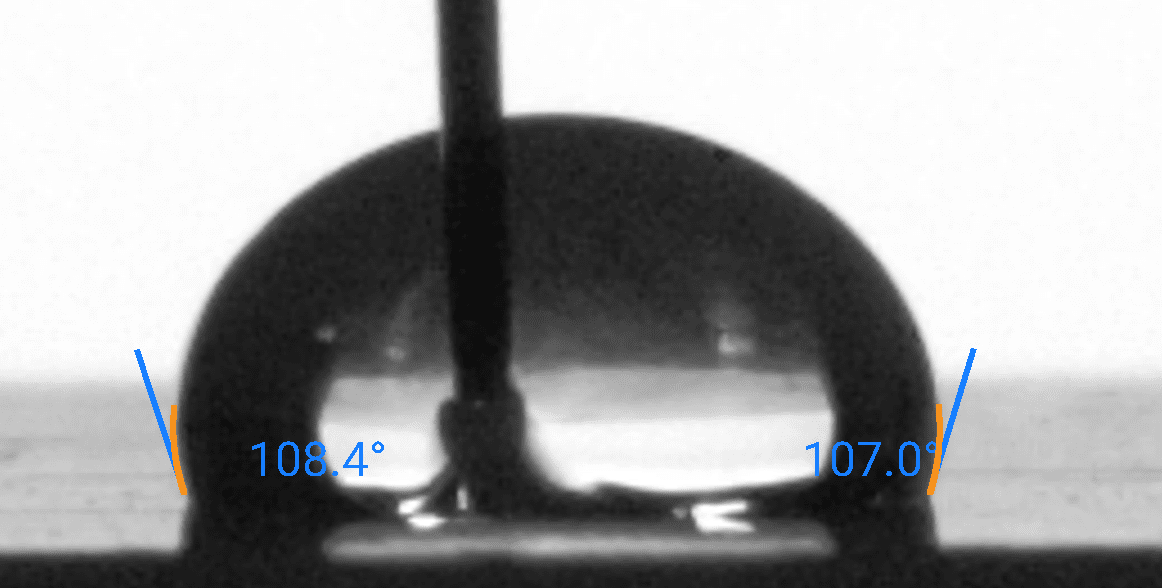
Dropometer contact angle measurement on a plasma-treated substrate, tracked from immediately post-treatment through a queued treatment-to-bond interval. This is the type of output used to decide whether a part proceeds to bonding or needs re-treatment.

Sessile drop contact angle measurement: DI Water on Teflon surface, left contact angle 108.4°, right 107°

Sample Pre-Bond Screening: Treatment Activation and Decay Tracking

Sample Contact Angle (°) Time Since Treatment Release Decision
Treated part, measured immediately (baseline) 38° 0 hours PASS
Treated part, same batch 44° 4 hours PASS
Treated part, same batch 61° 24 hours MONITOR — confirm against your decay window before bonding
Treated part, same batch 79° 72 hours FAIL — re-treat before bonding

The immediate post-treatment reading establishes the PASS baseline. Four hours later, the contact angle has risen modestly, still comfortably within a typical PASS band. By 24 hours, the rise is substantial enough to warrant a MONITOR decision, this part may still bond acceptably, but only if your own validated decay window extends that far; if it doesn't, treat it as a hold. By 72 hours, the surface has largely reverted, a FAIL decision and a re-treatment, not because anything went wrong at the treatment step, but because too much time passed. This output would be included in the pre-bond release record used to decide whether a part proceeds.

Troubleshooting

Plasma treatment verification troubleshooting guide

Start condition: bond failures, delamination, or inconsistent bond strength are showing up. Use the signal pattern to identify the most likely cause.

Signal A

Higher-than-baseline contact angle immediately after treatment

Likely cause: Insufficient plasma or corona dose from equipment power, speed, or gas-flow drift.
Action: Recalibrate treatment parameters against your validated recipe.

Signal B

Contact angle rises meaningfully between treatment and bonding

Likely cause: Treatment decay (hydrophobic recovery) from too much elapsed time.
Action: Shorten the treatment-to-bond interval or re-treat parts exceeding the measured decay window.

Signal C

High contact-angle variability across zones on the same part

Likely cause: Uneven treatment coverage from fixturing, nozzle path, or electrode geometry.
Action: Adjust fixturing or nozzle path and add zone mapping to the release protocol.

Signal D

Persistently high contact angle despite nominal treatment settings

Likely cause: Substrate-specific treatment mismatch (for example, PTFE or certain polyolefins needing a different recipe).
Action: Qualify treatment parameters specifically for that substrate.

Signal E

Activation measures within baseline but bond strength is still weak

Likely cause: Adhesive cure conditions, exceeded open time, or joint design and loading, not surface activation.
Action: Route the investigation to adhesive cure schedule, dispensing QC, and joint design review.

FAQ

Common questions before adoption

No. It's a pre-bond upstream screen that verifies surface activation. Confirm final bond suitability with your established lap-shear, peel, or pull-test acceptance criteria.

Yes. Plasma and corona-activated surfaces decay over time through hydrophobic recovery, a well-documented phenomenon. A part treated correctly but bonded too late can still produce a weak bond.

It varies by polymer, treatment method, and storage conditions, there's no single universal number. Characterize your own decay curve for each substrate and treatment combination rather than relying on a generic published figure.

It rules out surface activation as the cause, pointing the investigation toward adhesive cure conditions, dispensing and mixing, or joint design and loading instead.

Yes, contact angle measurement is a direct way to confirm whether a hard-to-treat substrate actually reached a bondable activation level, since some polymers need a different treatment recipe than a general-purpose one provides.

Yes. Zone mapping across a part's surface detects localized under-treatment that a single spot check would miss, useful for catching fixturing or nozzle-path issues.

Yes. The Dropometer produces numeric contact angle and surface energy data with replicate records, timestamps, and time-since-treatment, usable in NCR responses, CAPA files, and supplier audit packages, relevant for regulated bonding processes in aerospace and medical device manufacturing.

Business Impact

What Changes When You Verify Activation Before Bonding, Not After a Failed Joint

Before and with Dropometer; operational outcomes

Metric Before Dropometer With Dropometer Indicative Benchmark
Failure discovery point Bond-strength testing or a field failure, after committing the assembly Contact angle and surface energy screening just before bonding "COPQ from late-discovered defects typically 15–20% of revenue for manufacturers without upstream gates"
Decay-window management Fixed treatment-to-bond interval assumed safe regardless of actual decay Measured decay curve defines a validated, substrate-specific bonding window "Distinguishes a genuine equipment problem from a scheduling problem"
Failure diagnosis Trial-and-error across treatment settings, adhesive, and joint design Rule-out logic isolates whether the cause is surface-activation-related before touching other variables "Structured diagnosis vs. guess-and-check troubleshooting"
Batch-to-batch consistency Unmeasured variability across shifts, equipment drift, or queue time Tracked per batch against a verified activation baseline "Replicate spread detects drift before it reaches a bonded assembly"
Audit documentation Subjective "it was treated" assumption; not defensible under audit Numeric activation logs with timestamps and time-since-treatment "Applicable to NCR, CAPA, incoming inspection, and supplier qualification records"

Instant ROI Snapshot

Plasma Treatment Verification ROI Snapshot

Estimate avoided rebonding and rework cost from under-treated or decayed surfaces.

Each Dropometer unit is $5,000 — default models 1 unit.
Cost of rebonding or disassembly/rework attributable to inadequate or decayed plasma treatment specifically, not blanket assembly rework.
Conservative range: 20-30%.
Share attributable to this specific failure mode, not blanket scrap/cost.

Result

~0
Monthly savings
~0
Payback period
~0
Year-1 net benefit

Monthly savings = preventable rework cost + preventable scrap cost + other monthly savings.

Honest scope

What Activation Verification Cannot Tell You About a Bond

Knowing the limits of any measurement tool is part of using it responsibly.

No universal contact angle or surface energy threshold applies across all substrates and adhesive systems; validate your own threshold against lap-shear or peel data.
Hydrophobic recovery rate varies by polymer type, treatment method, and storage conditions; don't assume a published decay curve applies directly to your material without your own verification.
This instrument verifies surface activation, not bond strength, adhesive cure state, or joint mechanical performance.
Uneven treatment can pass an average reading while still containing a locally under-treated zone; use zone mapping, not a single spot check, on parts with a failure history.
Environmental conditions (humidity, temperature) at the time of measurement should be recorded alongside every reading.
Use activation verification as an upstream quality gate, then confirm final suitability with your established bond-strength acceptance tests.

Use this page to improve pre-bond activation verification and decay-window management, not to replace bond-strength testing. The Dropometer is one layer in a quality system, not a substitute for one.

How this page was created

Editorial and technical transparency notes for this page.

Transparency Details 4 checklist items
01

Drafting assistance

Initial draft created with AI assistance (Claude Opus 4.8), then rewritten for technical clarity.

02

Technical review

Reviewed and edited for technical accuracy by a surface-science specialist.

03

Verification steps

Identifiers, units, thresholds, and key claims checked against cited sources before publication.

04

Updates

Reviewed every 12 months or when the underlying standard changes.

Report a correction

Spotted an issue in this summary? Send a correction request and our team will review it.

Correction Request

We work hard to keep this standards summary accurate and up to date. If you spot an error (wrong revision/year, missing requirement, incorrect interpretation, or broken link), tell us and we'll review it.

Contact us to report a correction
References

Sources

1.
Aging of Plasma-Activated Polyethylene and Hydrophobic Recovery of Polyethylene Polymers. Polymers (MDPI), 15(24), 4668 (2023). https://doi.org/10.3390/polym15244668
2.
Analysis of time-dependent hydrophobic recovery on plasma-treated superhydrophobic polypropylene using XPS and wettability measurements. Scientific Reports (Nature), 14 (2024). https://www.nature.com/articles/s41598-024-72573-y
3.
ASTM D2578-17, Standard Test Method for Wetting Tension of Polyethylene and Polypropylene Films. https://store.astm.org/standards/d2578
4.
Chen, X. et al. Contact angle measurement with a smartphone. Review of Scientific Instruments, 89, 035117 (2018). https://pubs.aip.org/aip/rsi/article-abstract/89/3/035117/368179/Contact-angle-measurement-with-a-smartphone
5.
Fabrico. The Cost of Poor Quality (COPQ) in Manufacturing: 2026 Guide. https://www.fabrico.io/blog/cost-of-poor-quality-copq-manufacturing-guide/
6.
Making Strategy Happen. The Cost of Quality: The 1-10-100 Rule. https://www.makingstrategyhappen.com/the-cost-of-quality-the-1-10-100-rule/