
Cleanliness and Contamination
Surface Cleanliness Testing and Verification: Evaluate Clean Surfaces with Contact Angle Measurements Alongside the ATP Test
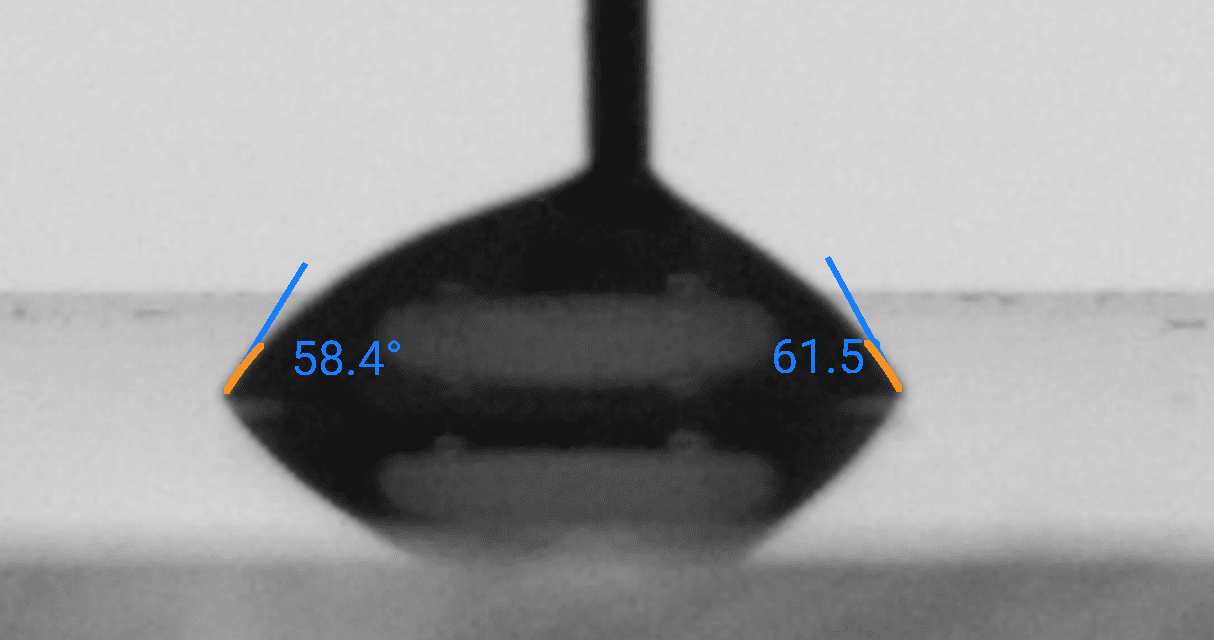
An ATP test shows biological residue. It does not show oil, silicone, cleaning agent or other films that stop a coating, adhesive or seal from working. A water contact angle check on the cleaned surface adds a fast, numeric verification of that second kind of surface cleanliness.

Written by
Gurdeep Singh Saini
Holds a BASc in Mechanical Engineering from Ryerson University (now Toronto Metropolitan University) and an MASc from York University. He develops the automatic edge and baseline detection behind the Dropometer's analysis.
COO at Droplet Lab
Read More

Technical Review by
Droplet Lab Team
Droplet Lab builds precision instruments and software for surface science measurement, specialising in contact angle analysis and surface tension characterisation. Used by researchers across materials science, pharmaceuticals, coatings, and advanced manufacturing, Droplet Lab's Dropometer has contributed to studies published in peer-reviewed journals including Advanced Functional Materials (Impact Factor 19). The team combines instrument engineering with deep domain knowledge in wettability science with a focus on practical accuracy.
Read More
Reviewed By
Droplet Lab Team
Droplet Lab builds precision instruments and software for surface science measurement, specialising in contact angle analysis and surface tension characterisation. Used by researchers across materials science, pharmaceuticals, coatings, and advanced manufacturing, Droplet Lab's Dropometer has contributed to studies published in peer-reviewed journals including Advanced Functional Materials (Impact Factor 19). The team combines instrument engineering with deep domain knowledge in wettability science with a focus on practical accuracy.



Validated measurement approach for surface cleanliness
How the Dropometer itself has been validated, and where customers have used it.
Peer reviewed method
The Dropometer drop shape method is published in Review of Scientific Instruments and Colloids and Surfaces A. Contact angle was validated against a KRUSS DSA100E, with a published accuracy of 0.35°.
See the validation papersCustomer evidence on cleaning
A US medical device manufacturer measured a water drop on a mandrel about 1 mm across during a live demo, bought a Dropometer to check catheter surfaces before coating, and ordered a second unit within seven months.
Read the case studyExample cleaning verification log: ATP and contact angle together
Example data only. Your values and benchmarks will differ and must come from your own references.
How to read this log
Example gates: ATP under the site benchmark, and contact angle within 8° of the clean baseline. Each test catches something the other misses. Green rows are released, amber rows get additional cleaning, red rows are held.
Example data, not customer data. Water contact angle on cleaned stainless steel, read at a fixed time after deposition; ATP in relative light units from one luminometer.
Report a correction
Spotted an issue in this summary? Send a correction request and our team will review it.
Correction Request
We work hard to keep this page accurate and up to date. If you spot an error (wrong revision/year, missing requirement, incorrect interpretation, or broken link), tell us and we'll review it.
Contact us to report a correctionReferences
1.
ARHAI Scotland. Literature review and practice recommendations: existing and emerging technologies used for monitoring the effectiveness of decontamination of the health and care environment. ATP bioluminescence and fluorescent markers. Version 2.0, 2023. https://www.nss.nhs.scot/media/4227/atp-and-fluorescent-markers-literature-review-v2.pdf
2.
Ho, K., Shiba, T., Chen, C.-Y., Kim, D. M. Plasma treatment to remove titanium surface contaminants and improve implant biocompatibility: an in vitro study. Biomimetics 10:571, 2025. Customer publication that used the Dropometer; the link goes to our analysis of the paper. https://dropletlab.com/validation/citations/analysis/plasma-treatment-to-remove-titanium-surface-contaminants-and-improve-implant-biocompatibility-an-in-vitro-study/
3.
ASTM F22. Standard test method for hydrophobic surface films by the water break test. https://dropletlab.com/industry-standards/astm-f22/
4.
ASTM F21. Standard test method for hydrophobic surface films by the atomizer test. https://dropletlab.com/industry-standards/astm-f21/
5.
Chen, X. et al. Contact angle measurement with a smartphone. Review of Scientific Instruments 89(3):035117, 2018. https://pubs.aip.org/aip/rsi/article-abstract/89/3/035117/368179/Contact-angle-measurement-with-a-smartphone
6.
Surface tension measurement with a smartphone using a pendant drop. Colloids and Surfaces A: Physicochemical and Engineering Aspects.
https://www.sciencedirect.com/science/article/abs/pii/S0927775717307744