Primary surface measurement reported
Surface tension of polymer and surfactant–polymer solutions was measured as a function of surfactant concentration at room temperature.
Client Citation Analysis
Surface tension of polymer and surfactant–polymer solutions was measured as a function of surfactant concentration at room temperature.
The paper attributes surface-tension measurements to a “pendant drop tensiometer (Droplet Lab, Markham, ON, Canada),” using smartphone imaging and Young–Laplace droplet-profile fitting.
The surface-tension data were used to compare mixed polymer–surfactant solutions against pure surfactant solutions, identify when the mixtures became more or less surface-active, and relate those changes to rheological and conductivity trends across cationic, nonionic, and anionic polymer systems. The clearest contrast was between CHEC + Stepwet, which showed a strong surface-tension minimum, and xanthan + HTAB, where solution surface activity shifted upward relative to the pure surfactant trend.
The measurement for each solution was performed multiple times, and the average value was determined.
The paper reports surface tension measurements for polymer solutions and polymer–surfactant mixtures. These measurements were tracked against surfactant concentration to compare mixed-solution surface activity with the corresponding pure surfactant behavior.
The surface-tension results were interpreted alongside steady-shear rheology and electrical conductivity. Rheology was summarized through power-law consistency index 𝐾 and flow behavior index 𝑛, and conductivity trends were used with surface-tension plots to interpret interaction strength and concentration-dependent changes.
pendant drop tensiometer (Droplet Lab, Markham, ON, Canada)
Fann viscometer (Fann Instrument Co., Houston, TX, USA)
Haake viscometer (Thermo Fisher Scientific, Waltham, MA, USA)
Thermo Orion 3 Star conductivity meter (Thermo Fisher Scientific, Waltham, MA, USA)
variable-speed Gifford-Wood homogenizer (Model 1 L)
variable autotransformer (variac)
The Dropometer was used as a pendant-drop surface-tension system at room temperature. The authors captured a high-resolution image of each pendant droplet with a smartphone camera, analyzed the image using company-supplied software, and obtained surface tension by fitting the droplet profile with the Young–Laplace equation. The reported output was the average surface tension for each solution after repeated measurements.
Across the paper, those Dropometer-derived curves helped the authors distinguish mixtures that became more surface-active than the pure surfactant from mixtures where surfactant migration to the polymer shifted the solution toward higher surface tension.
The cationic hydroxyethyl cellulose system with anionic Stepwet showed dramatic coupled changes in rheology and surface activity. Surface tension first decreased, reached a minimum, and then rose again with increasing surfactant concentration, matching the strong nonmonotonic rheology reported for the same system.
For CHEC + Alfonic, CHEC + HTAB, guar + Stepwet, guar + HTAB, xanthan + Alfonic, and xanthan + Stepwet, the mixed-solution surface-tension curves fell below the corresponding pure-surfactant curves over stated concentration ranges. The authors interpret these shifts as evidence that surfactant–polymer complexes were more surface-active than the surfactant molecules alone.
For CHEC with nonionic Alfonic, the mixed-system surface-tension plot deviated strongly from the pure-surfactant curve between 200 and 400 ppm, and the authors state that the CMC from the surface-tension data was 350 ppm. This made the Dropometer data central to identifying where the mixed-system behavior changed.
For NHEC and guar gum, the paper describes weak to mild or weak to moderate interactions overall, and the surface-tension plots mostly decreased smoothly with surfactant concentration. In the comparison plots, Amphosol and HTAB were the most surface-active in the presence of NHEC, and Amphosol with guar gum was the most surface-active among the guar systems.
In the anionic xanthan gum system with cationic HTAB, the mixed-solution surface tension remained much larger than that of the pure surfactant. The authors connect that trend to migration of surfactant from solution to polymer molecules, while also reporting a substantial drop in consistency index for the same pairing.
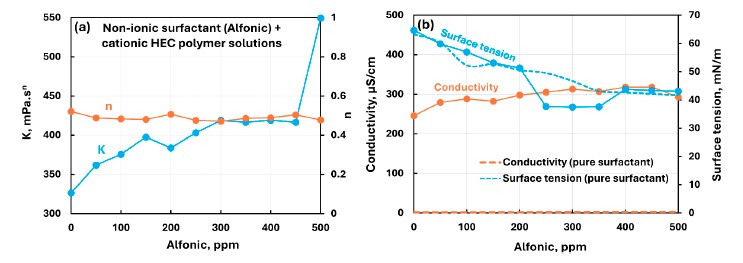
This figure is useful for seeing where the CHEC–Alfonic surface-tension curve departs from the pure-surfactant trend and where the paper states a CMC of 350 ppm.
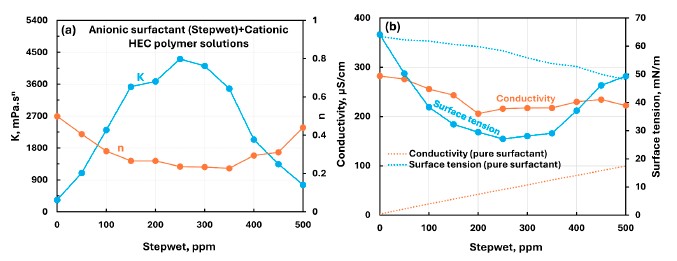
This figure shows the clearest nonmonotonic surface-tension response in the paper, with a pronounced minimum that accompanies the strongest rheological changes.
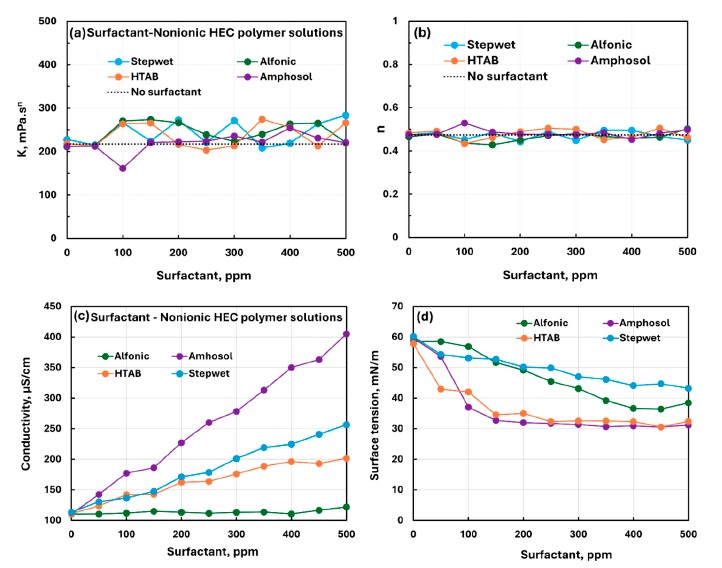
This comparison plot is useful for quickly seeing the relative surface activity order among the four NHEC mixed systems.
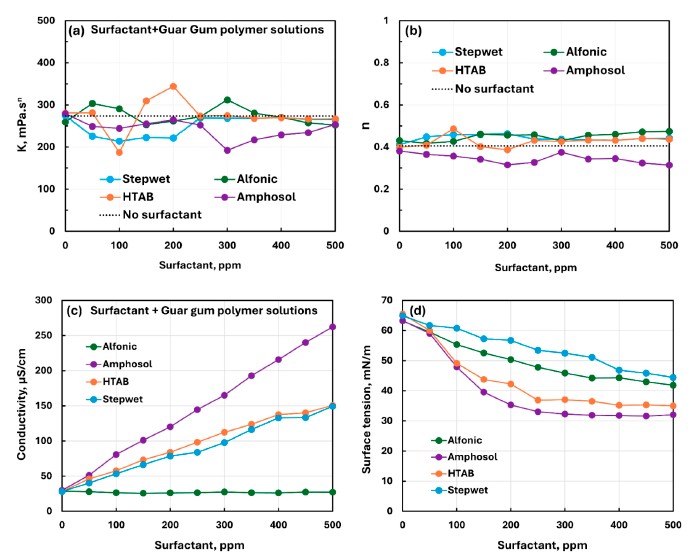
This figure condenses the guar-gum results into a single comparison view and highlights the smoother surface-tension trends of the nonionic polymer systems.
The paper frames polymer–surfactant interactions as important across applications such as drug delivery, enhanced oil recovery, hydraulic fracturing and drilling, cosmetics, foods, and chemical processing. Within that context, the Dropometer-derived surface-tension data gave the authors a direct way to see whether a given polymer–surfactant pairing made the mixed solution more surface-active than the pure surfactant or shifted surfactant away from the free solution phase.
That mattered because the surface-tension curves were interpreted together with rheology and conductivity, so the paper could distinguish strongly interacting charge-paired systems from milder nonionic combinations. In practice, the surface-tension results were part of the paper’s evidence for why CHEC + Stepwet behaved exceptionally strongly, why NHEC and guar systems changed more gently, and why xanthan + HTAB moved in the opposite surface-activity direction from several other mixtures.
The Dropometer curves let the authors distinguish mixtures that dropped below the pure-surfactant line from mixtures that stayed above it, which was central to how the interaction mechanisms were interpreted.
This combination produced the strongest coupled changes in consistency, flow behavior, conductivity, and surface tension, making it the paper’s standout interaction regime.
The reported 200–400 ppm deviation range and the stated 350 ppm CMC came directly from the surface-tension behavior, giving a concrete example of how the Dropometer data were used to read regime changes.
For NHEC and guar gum, the surface-tension trends were generally smoother and better suited to side-by-side comparison among surfactants than the strongly nonmonotonic CHEC + Stepwet case.
This pair combined a large drop in consistency with higher mixed-solution surface tension than the pure surfactant, illustrating that strong interaction did not always mean a more surface-active solution.