Primary surface measurement reported
Equilibrium surface tension (aqueous/air) and oil–water interfacial tension (aqueous/WO-15) were reported as a function of NCC or surfactant concentration (Figures 8–9).
Client Citation Analysis
Equilibrium surface tension (aqueous/air) and oil–water interfacial tension (aqueous/WO-15) were reported as a function of NCC or surfactant concentration (Figures 8–9).
The Dropometer is cited as a “smartphone-based pendant drop tensiometer (Droplet Lab, Markham, ON, Canada)” using droplet-profile fitting with the Young–Laplace equation via axisymmetric drop shape analysis (ADSA).
The surface- and interfacial-tension trends are used to contrast NCC’s weak surface activity with the strong tension reductions observed for molecular surfactants and to discuss how interfacial tension behavior relates to concentration-dependent catastrophic phase inversion behavior.
Each measurement was repeated 10 times per solution, and average values were reported.
4.4
0.691
0.475
3.2
3.0
Chemistry, Physical
Equilibrium surface tension of aqueous phases containing NCC or surfactants, and oil–water interfacial tension (WO-15 oil vs aqueous phase) as a function of stabilizer concentration (Figures 8–9).
Catastrophic phase inversion behavior was tracked using conductivity measurements during incremental aqueous-phase addition under rotor–stator mixing, and emulsion coalescence stability was evaluated by monitoring separated aqueous-phase volume over time in graduated cylinders.
The Dropometer (cited as a smartphone-based pendant drop tensiometer from Droplet Lab) was used for pendant-drop measurements in which a pendant droplet of the aqueous phase (containing NCC or surfactants) was formed at a stainless-steel needle tip and analyzed by fitting the droplet profile with the Young–Laplace equation using axisymmetric drop shape analysis (ADSA) to obtain surface tension (droplet suspended in air) and interfacial tension (droplet dispensed into a sealed quartz cuvette containing WO-15 oil).
These surface- and interfacial-tension curves are used in the paper to compare stabilizer surface activity and to discuss a low-concentration regime of sharp interfacial-tension reduction versus a higher-concentration regime where the interface is described as saturated in relation to catastrophic phase inversion behavior.
For NCC, equilibrium surface tension remains relatively high across the tested range, decreasing from 63.4 mN/m at 0.1 wt% to 62.3 mN/m at 2.0 wt% (Figure 8), and the paper characterizes this as negligible surface-tension reduction.
SDS and OTAC show large decreases in equilibrium surface tension from 0.1 wt% to 1.0 wt% (SDS: 44.23 → 33.74 mN/m; OTAC: 54.80 → 38.22 mN/m), while Amphosol and Alfonic reach 31.25 mN/m and 26.11 mN/m at 0.5 wt%, respectively (Figure 8).
The interfacial tension data show large reductions for surfactant systems, including SDS decreasing from 57.2 mN/m (no surfactant) to 4.61 mN/m at 0.1 wt% and 3.02 mN/m at 1 wt%, and Amphosol reaching 2.81 mN/m at 0.2 wt% while remaining below 3.4 mN/m across the tested range (Figure 9).
For NCC, the paper reports an initial decrease in interfacial tension at 0.1–0.2 wt% reaching a minimum of 38.3 mN/m, followed by a plateau or slight increase at higher concentrations (Figure 9).
The paper describes a sharp reduction in interfacial tension at lower surfactant concentrations before stabilizing near a minimum and states that this rapid initial drop coincides with a delay in catastrophic phase inversion; it also describes a higher-concentration threshold where the interface becomes saturated and further IFT decreases are minimal, while inversion occurs at lower aqueous phase fractions as excess surfactant accumulates in the bulk or micellar phase.
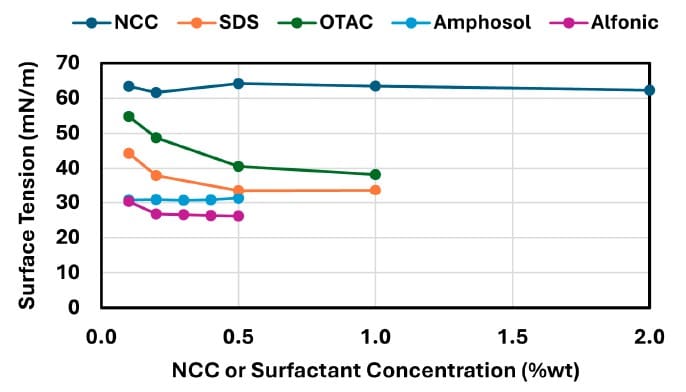
Shows equilibrium surface tension (aqueous/air) for NCC and surfactants (SDS, OTAC, Amphosol, Alfonic) as a function of concentration.
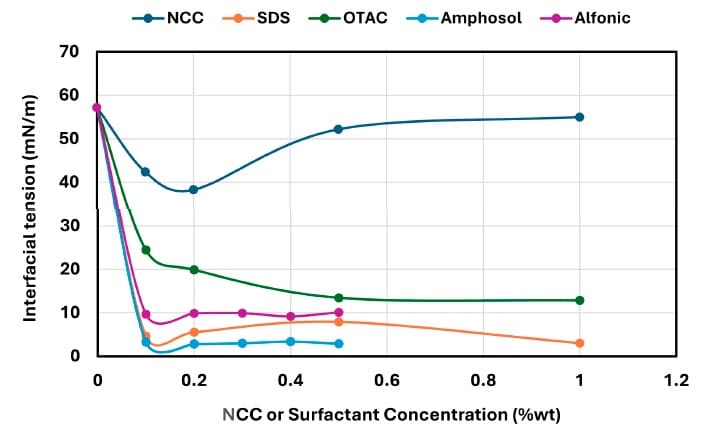
Shows oil–water interfacial tension (WO-15 oil / aqueous phase) for NCC and surfactants as a function of concentration, including sharp surfactant-driven reductions and a non-monotonic NCC trend.
Within the study’s focus on catastrophic phase inversion and emulsion stability, the Dropometer-derived pendant-drop surface and interfacial tension data provide the interfacial context used to compare particle-stabilized and surfactant-stabilized systems.
The paper uses these tension–concentration relationships to support its interpretation that NCC delays catastrophic phase inversion through interfacial jamming, while surfactant-stabilized systems show concentration-dependent inversion behavior associated with interfacial saturation and bulk/micellar accumulation at higher surfactant concentrations.
The paper reports pendant-drop measurements for surface tension (droplet suspended in air) and interfacial tension (droplet dispensed into WO-15 oil in a sealed quartz cuvette) using Young–Laplace fitting with ADSA.
Each surface/interfacial tension measurement was repeated 10 times per solution and reported as an average at 22 ± 1 °C.
The reported surface-tension data keep NCC near ~63 mN/m across concentration while surfactants substantially reduce surface tension (Figure 8), supporting a direct contrast in surface activity.
The paper links a sharp low-concentration IFT decrease and a higher-concentration near-minimum/plateau (interface saturation) to the observed concentration-dependent catastrophic phase inversion behavior (Figure 9).
The interfacial tension results differentiate very low IFT values for SDS and Amphosol from more moderate reductions for Alfonic and a more gradual decrease for OTAC (Figure 9).