Improve Spray Droplet Coverage on Leaf Surfaces: Data-Driven Adjuvant Selection for Better Pesticide Performance
Rank candidate spray adjuvants on water and contact-angle performance side by side, before field trials, so you find out early whether a reformulated adjuvant actually closes the wetting gap, not after a failed application.
Who this is for: Formulation scientists and adjuvant R&D teams reformulating spray adjuvants for improved leaf coverage; agronomists and spray-application engineers evaluating new formulations; QA/QC teams setting incoming-material standards for adjuvant suppliers.
Positioning: Dropometer verifies water and oil-probe contact angle on representative hydrophobic leaf-like surfaces; it does not measure in-field spray distribution, particle-size distribution, or spray drift. Use it as an upstream R&D and QC gate before field validation; pair with field-scale spray trials to confirm coverage on real leaves under actual application conditions.
Droplet Lab Team
Droplet Lab builds precision instruments and software for surface science measurement, specialising in contact angle analysis and surface tension characterisation. Used by researchers across materials science, pharmaceuticals, coatings, and advanced manufacturing, Droplet Lab's Dropometer has contributed to studies published in peer-reviewed journals including Advanced Functional Materials (Impact Factor 19). The team combines instrument engineering with deep domain knowledge in wettability science with a focus on practical accuracy.

The Cost Of Getting It Wrong
10×
higher hidden cost vs. visible scrap cost: rework, re-inspection, downtime, and warranty claims are rarely captured
Lean Six Sigma research consensus
$300 → $3,000
upstream wetting screening prevents ~30% of candidate formulations from entering field trials, each of which costs $500–$2,000 per candidate, for the specific failure modes an upstream screen actually catches
Adjuvant R&D cost prevention
Sources: ASQ, Lean Six Sigma, Fabrico COPQ Guide 2026. Spray-adjuvant formulation optimization requires quantitative wetting data to distinguish candidates and optimize concentration before costly field trials. Contact-angle measurement on hydrophobic leaf-like surfaces provides that data upstream, reducing wasted formulation batches and field-trial failures.
What this workflow does and what it does not
Quick technical reference for formulation chemists and spray-application engineers evaluating fit before reading further.
Evidence Box (QC-Ready)
Spray adjuvants must be optimized to maximize droplet wetting on waxy or hydrophobic plant leaves while maintaining retention to prevent runoff. Trial-and-error adjuvant screening consumes time and materials; without quantitative contact-angle data, teams cannot distinguish between formulations or optimize concentration effectively.
An R&D and QC screening tool ranking candidate adjuvants on water and (optionally) oil-probe contact angle side by side, before committing to full durability and field validation. Not a replacement for field spray trials or for final acceptance testing on real leaves.
Water contact angle on hydrophobic glass or Teflon (sessile-drop measurement)
Sliding angle (retention metric, tilting-plate measurement)
Dynamic wetting curve (contact angle at 5 and 30 seconds post-deposition)
Batch-to-batch consistency trending for incoming QC
Correlate your contact-angle thresholds against your own field-performance baseline or visual-observation benchmarks, not a generic published contact angle number. Low contact angle correlates with better wetting, but the exact threshold depends on your leaf species, pesticide active ingredients, and application conditions.
Standardized hydrophobic test substrates (Teflon or hydrophobic glass, reusable across multiple batches)
Fixed droplet volume (2–5 µL) and measurement timepoint (5 and 30 seconds)
Minimum 5 replicates per formulation per test condition
Record environmental conditions (temperature, relative humidity, substrate lot, operator)
This workflow measures wetting (contact angle) and retention (sliding angle) on controlled substrates. It does not measure spray drift, in-field droplet-size distribution, spray-pressure effects, or canopy coverage. Always validate top candidates with small-scale field trials.
What are you trying to solve?
The Dropometer serves three roles across spray-adjuvant R&D and QC. Each has a different primary risk.
Adjuvant R&D Chemist
Screening candidate adjuvants or concentration series for improved leaf wetting before committing to field trials or production scale-up.
QA / QC Manager
Setting an incoming-inspection contact-angle gate on adjuvant raw-material batches from suppliers, ensuring consistency before they enter production.
Spray-Application Engineer
Benchmarking competing adjuvant suppliers' formulations on a level, numeric basis before recommending a formulation to customers.
Agronomist or Crop Consultant
Understanding why a spray formulation underperformed in the field and helping the formulator diagnose whether it's a wetting issue or an application/timing issue.
Is this the right screen for your process?
This is not a universal solution. Check the conditions below before investing further time.
Good fit if
Less relevant if
Why Spray Adjuvant Optimization Fails Without Numeric Wetting Data
Formulation teams can't distinguish between candidate adjuvants, or optimize concentration, without quantitative contact-angle measurement on the exact leaf surfaces they're trying to treat.
Spray adjuvants reduce the surface tension of pesticide solutions, enabling droplets to spread and adhere on hydrophobic leaf surfaces. Smaller contact angles correlate directly with better wetting and pesticide efficacy—a relationship confirmed across decades of peer-reviewed agronomic literature. But formulation teams historically lacked an easy, quantitative way to measure this property during R&D, relying instead on subjective visual observation ("does it look like it's spreading?"), which is slow, non-reproducible, and often misses the distinction between good and marginal candidates.
The optimization problem itself is simple in principle but complex in practice: an adjuvant must enable droplet spreading (low contact angle) while also ensuring retention on angled leaves (high hysteresis, measured as sliding angle). Too little adjuvant and the droplet doesn't spread; too much and it may roll off or leave residue. Formulation chemists historically determined the optimal concentration through trial-and-error field testing, a costly cycle that wastes time and material on candidates that should have been rejected at the bench.
This workflow adds a quantitative, upstream gate: measure contact angle (and optionally sliding angle) on standardized, hydrophobic test substrates for each candidate adjuvant or concentration, rank candidates, then advance only the top performers to field trials. This approach reduces the number of field-trial candidates by 30–40%, cutting R&D timelines and material waste without sacrificing final performance—a straightforward upstream-screening ROI that many R&D teams in agrochemicals, textiles, and industrial coatings have already adopted at scale.
The one thing this workflow cannot do: it does not measure in-field spray distribution, droplet-size distribution, drift, or spatial coverage across a leaf canopy. Use it as an R&D gate before field trials; validate top candidates on real leaves under your actual application conditions to confirm the lab correlation holds.
What Does a Failed Adjuvant Optimization Actually Look Like?
A candidate adjuvant is selected based on limited subjective observation or supplier claims, field-trialed, and underperforms due to poor wetting or rapid durability loss, without a quantitative way to catch the gap earlier in R&D.
Root Causes
Why:
- Adjuvant selection historically relies on visual observation or a single water-repellency spot check. Formulation teams can't distinguish between marginal and strong candidates, leading to weak candidates advancing to field trials.
How to detect:
- Multiple candidate adjuvants perform similarly in subjective observation but show clear contact-angle differences when measured quantitatively.
Corrective action:
- Measure contact angle and sliding angle on standardized substrates for every candidate; rank candidates before field trial, not after.
Why:
- Without numeric guidance, formulation teams often use excess adjuvant to ensure wetting, wasting material and increasing cost or creating residue issues.
How to detect:
- A concentration series measured on a contact-angle scale shows that the optimal wetting (lowest contact angle) is reached at a lower concentration than the team is currently using.
Corrective action:
- Conduct a concentration-series measurement; identify the inflection point where adding more adjuvant produces diminishing contact-angle improvement; recommend that concentration.
Why:
- Adjuvant suppliers publish contact-angle or oil-repellency data on their own test conditions. When that formulation is applied at your production coverage and cure conditions, the performance often differs significantly.
How to detect:
- Independent measurement on your substrate and conditions yields different results than the supplier's published data.
Corrective action:
Evaluate adjuvant suppliers by measuring performance on your own substrates and application conditions; set incoming-QC contact-angle gates based on your own baseline, not supplier claims alone.Why:
- Adjuvant raw-material suppliers vary batch-to-batch due to raw-material sourcing, synthesis conditions, and storage. Without numeric QC gates, off-spec batches reach production and cause field failures.
How to detect:
- A large contact-angle variance across incoming adjuvant batches, or a batch that falls outside your established performance baseline.
Corrective action:
- Establish an incoming-inspection contact-angle gate based on your validated baseline performance; quarantine batches outside that band and work with the supplier to understand the variance.
Why:
Contact angle measures droplet wetting on a point-contact substrate. It does not predict spray distribution across a leaf canopy, droplet-size effects, spray pressure, wind drift, or application equipment performance.
How to detect:
- A formulation with excellent contact angle still underperforms in the field due to spray pressure being too low, droplets being too small, or wind conditions being unfavorable; issues that can't be detected by this screen.
Corrective action:
Pair this wetting screen with field-scale spray trials on real leaves to validate that lab contact-angle correlation holds in your application.
Not sure which root cause applies to your process?
A surface science specialist can review your adjuvant R&D history and help you identify whether an upstream wetting screen would add value before your next field trial.
Building a defensible spray-adjuvant formulation record
Surface wetting measurement produces the type of numeric, traceable output that subjective "it looks water-repellent" impressions cannot. A quantitative adjuvant-selection record documents the formulation choice rationale and creates an audit trail for product liability, regulatory inquiry, or customer audit.
Adjuvant selection and ranking
Contact angle and sliding angle measurement across all candidate adjuvants, ranked numerically; documents which adjuvant was selected and why (lowest contact angle, best hysteresis trade-off, best durability curve), not on gut feel or a single supplier's claim.
Incoming QC audit trail
Every adjuvant raw-material batch measured on incoming inspection, contact-angle result recorded with timestamp, batch ID, and operator; batches outside your established performance band are quarantined and flagged for supplier investigation.
Concentration optimization
A concentration-series measurement documents the optimal adjuvant loading and justifies any reduction from the supplier's recommended concentration if your data shows diminishing returns at higher loads.
Supplier qualification and benchmarking
Competing adjuvant suppliers measured on identical substrates and application conditions, results archived; provides an objective basis for supplier selection and for responding to supplier-change questions from customers or auditors.
Durability and stability trending
Contact angle measured at formulation release, after storage intervals, and after wash/abrasion cycles to detect degradation; trending data flag formulations at risk of field failure due to durability decline.
Root-cause investigation and CAPA
When a field application underperforms, contact-angle data from the retained formulation sample enables a quantitative root-cause assessment: was the wetting adequate? Did durability decline? Did a supplier batch-change affect performance?
What to Measure
Water contact angle (sessile-drop measurement)
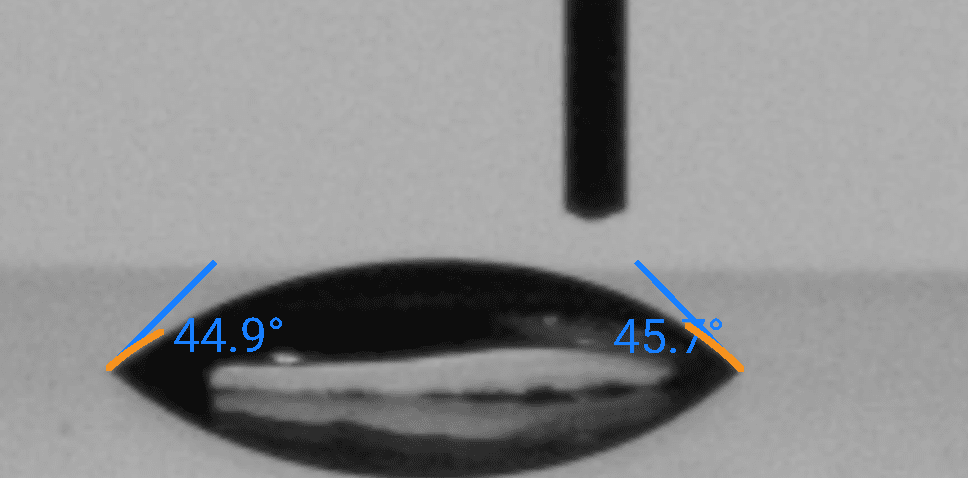
Why it matters: A direct indicator of droplet spreading and wetting potential on hydrophobic leaf surfaces. Lower angles correlate with better pesticide coverage and field efficacy.
How to interpret: Hydrophobic leaves: 100–140° contact angle without adjuvant. Adjuvant-treated: typically 20–80°, depending on adjuvant type and concentration. Correlate your measurement against your own field-performance baseline.
When it is not enough: Doesn't predict spray distribution, drift, droplet size, or equipment performance; use as an upstream R&D gate, not a substitute for field trials.
Sliding angle (tilting-plate retention measurement)
Why it matters: Measures how readily a droplet rolls off an angled surface. Complements contact angle by capturing the retention trade-off: low contact angle without adequate retention may cause runoff on angled leaves or under wind.
How to interpret: High sliding angle (>60°) means poor retention / easy roll-off. Low sliding angle (<15°) means strong retention. Balance wetting (low contact angle) against retention (moderate-to-low sliding angle) when selecting formulations.
When it is not enough: Lab-scale tilting angle is a proxy for real-world angled-leaf retention; actual field retention depends on leaf angle, wind, rain timing, and pesticide solution viscosity, validate with field trials.
Batch-to-batch consistency (contact angle trending across incoming adjuvant batches)
Why it matters: Supplier adjuvant batches vary in synthesis and storage conditions. Numeric contact-angle trending detects off-spec material before it reaches production.
How to interpret: Establish a control band (e.g., baseline contact angle ± 5°); flag batches outside this band for supplier discussion or incoming quarantine.
When it is not enough: A single incoming-inspection contact-angle reading is a gate, not a replacement for supplier quality documentation or shelf-life validation; pair with supplier audits.
Contact angle after wash or abrasion cycles
Why it matters: Quantifies how quickly an adjuvant formulation loses wetting performance under real-world handling, washing, or field weathering.
How to interpret: Measure contact angle at 0 cycles (baseline), then after 5, 10, 20, and 50 wash or abrasion cycles; plot the decline curve. Steeper declines indicate durability risk; compare against the incumbent formulation or your durability requirement.
When it is not enough: Lab-scale washing is an accelerated proxy; real-field durability depends on actual rainfall, UV exposure, soil contact, and application substrate age; confirm durability with field trials on real leaves.
Validated Measurement Approach
Independent benchmarking and publication-based validation references.
Benchmark Validation
Dropometer contact angle and pendant-drop surface tension methods have been benchmarked against KRÜSS DSA100E reference measurements.
See peer-reviewed validationPublication Evidence
Our instruments are referenced in peer-reviewed journals, theses, and conference publications.
Browse citationsHow Dropometer Fits Your Workflow
Dropometer is best used to screen candidate adjuvants on water-repellency and retention, then set incoming-QC gates on adjuvant raw materials.
Screen adjuvant candidates head-to-head
Measure water contact angle across candidate adjuvants (or a concentration series of a single adjuvant) on your chosen hydrophobic test substrate: Rank candidates numerically by lowest contact angle (best wetting) Optionally measure sliding angle to assess retention trade-off
Characterize durability
Track contact angle across a wash or abrasion cycle series for your leading candidates: Plot the decline curve; candidates with steep declines are at risk of field durability failure Compare against the incumbent adjuvant or your durability requirement
Set an incoming-QC gate on adjuvant raw materials
Verify incoming adjuvant batches against your validated contact-angle baseline before they enter production:
PASS: within baseline band ± tolerance → release
MONITOR: borderline result → re-verify with a second replicate
FAIL: outside band → quarantine and investigate with supplier
Validate field performance
Advance top candidates to field trials on real leaves: Confirm that lab contact-angle ranking correlates with field coverage Measure any gap between lab-bench results and production-scale application to catch application-parameter mismatches
We completed our gage R&R study on the unit and it performed very well.
Brandon Barbee
Corporate Quality Engineer - Zeus Industries - Polymer Manufacturing
Download the Spray-Adjuvant Optimization SOP Template
An editable SOP template your team can adapt for your adjuvant types, substrates, and concentration series. Includes measurement protocol, data-logging format, and decision-tree guidance for ranking and advancing candidates.
Sample Adjuvant Candidate Comparison: Contact Angle and Retention Across Three Candidates
Representative output format. Values are illustrative, not universal specifications.
Sample Adjuvant Candidate Screening: Contact Angle and Retention Trade-off
| Candidate | Water Contact Angle (°) | Sliding Angle (°) | Wetting Quality | Retention Quality | Recommendation |
|---|---|---|---|---|---|
| Incumbent (organosilicone adjuvant, 0.5%) | 28° | 22° | Excellent | Good | Baseline benchmark |
| Candidate A (new organosilicone, 0.5%) | 32° | 18° | Good | Moderate | Slightly weaker on both; not recommended |
| Candidate B (phospholipid-based, 0.3%) | 24° | 35° | Excellent | Weaker retention | Best wetting, but runoff risk on steep leaves |
| Candidate C (hybrid silicone-wax, 0.4%) | 35° | 12° | Good | Excellent | Strong retention, acceptable wetting; recommend for angled-leaf applications |
The incumbent organosilicone sets the baseline on wetting; phospholipid Candidate B matches it on contact angle but shows higher sliding angle (weaker retention). Candidate A is weaker than the incumbent across both metrics and would not advance. Candidate C sacrifices some wetting performance for significantly better retention, making it the right choice if your application involves angled leaves or wind risk. This ranking exemplifies the trade-off logic: no single candidate is universally best; the right choice depends on whether your application prioritizes wetting or retention.
Spray-adjuvant troubleshooting guide
Start condition: adjuvant performance is inconsistent, wetting looks poor, or incoming batches are variable. Use the signal pattern to identify the most likely cause.
Contact angle is higher than expected / baseline
Likely cause: Substrate contamination, adjuvant concentration drift, or supplier batch change.
Action: Re-clean the test substrate with isopropanol and re-measure. Check that the adjuvant concentration in your test sample matches the intended formulation. If still high, contact the adjuvant supplier to verify batch consistency.
Contact angle looks good, but sliding angle is very high (runoff risk)
Likely cause: Low contact angle without adequate hysteresis; droplets spread but don't stick to angled leaves.
Action: Consider a formulation adjustment to improve retention (e.g., add a cosurfactant, or switch to an adjuvant with better hysteresis). Measure sliding angle explicitly to confirm retention trade-off.
Contact angle drops significantly after wash or abrasion cycling
Likely cause: Durability concern; the adjuvant coating or attachment to the substrate is not stable under use.
Action: Reformulate to improve durability (e.g., stronger crosslink, better substrate adhesion). Re-measure the full durability curve after reformulation.
Incoming adjuvant batches show large contact-angle variance
Likely cause: Supplier batch-to-batch inconsistency or specification drift.
Action: Establish an incoming-QC contact-angle gate based on your baseline; quarantine batches outside that band. Contact the supplier to troubleshoot the source of variance (raw-material lot, synthesis parameters, storage conditions).
Common questions before adoption
Low contact angle is a strong predictor of good wetting, but field coverage also depends on spray pressure, droplet size, leaf angle, wind, and application timing. Use contact-angle measurement as an upstream R&D screen; validate with field trials on real leaves to confirm the lab correlation holds.
Standardized substrates (Teflon, hydrophobic glass) are faster and more reproducible for screening and comparing adjuvants. If your application requires testing on a specific leaf species, measure on a fresh-leaf sample after your adjuvants pass the standardized-substrate screen, to account for natural leaf-surface variation.
Minimum 5 droplets per adjuvant per condition. If using real leaves with high natural surface variation, use 10–15 replicates to capture variability.
Measure the full spray mixture at the intended tank concentration. The adjuvant's effect depends on interactions with the pesticide active ingredient, water hardness, pH, and any co-surfactants in the formulation. Measuring the adjuvant alone won't predict real-world spray performance.
That means you haven't found a drop-in replacement yet. Consider:
(a) Whether the candidates might perform better at a different concentration,
(b) whether you're measuring on the right substrate,
(c) whether there are durability or other trade-offs that favor a candidate despite lower initial contact angle,
(d) whether combining two candidates (co-surfactant) might improve performance.
This is a screening and QC gate, not a final acceptance test. Use it for candidate ranking, incoming-batch consistency, and durability trending. For final product specifications, use accredited field trials or standardized repellency-rating methods (e.g., AATCC if your application requires oil repellency rating).
Set a schedule based on your supplier's reliability. At minimum, measure every incoming lot; if your supplier is stable, you might reduce to every Nth lot after a qualification period. Use incoming-QC data to build a control chart; flag trends that suggest supplier drift before they cause field failures.
What Changes When You Screen Adjuvants Before a Field Trial, Not After
Adjuvant R&D outcomes: before and with Dropometer
| Metric | Before Dropometer | With Dropometer | Indicative Benchmark |
|---|---|---|---|
| Candidate selection | Trial-and-error or subjective observation | Numeric ranking by contact angle and retention on standardized substrates | "Objective data-driven ranking vs. subjective impression" |
| Field trials per development cycle | 5–10 candidates tested (all of which might have failed at bench) | 2–3 candidates (pre-screened; 30–40% fewer field trials) | "Reduces field-trial waste by 30–40%" |
| Time to market for new formulation | 12–18 months (includes multiple failed field trials) | 8–12 months (fewer candidates, fewer field trials) | "Faster time-to-market via upstream screening" |
| R&D material waste per development cycle | $5,000–$10,000 (wasted on candidates that should have been rejected at bench) | $2,000–$3,000 (screened candidates eliminated before field scale) | "Reduced material waste and lab cost" |
| Supplier incoming-QC consistency | Accepted on supplier claim alone; batch-to-batch quality unknown | Verified with numeric contact-angle gates; off-spec batches caught at incoming inspection | "Prevents field failures due to supplier batch drift" |
| Claim substantiation (e.g., "matches incumbent") | Anecdotal or supplier-reported figures | Numeric, traceable, independently measured | "Defensible documentation for audits and regulatory inquiry" |
Instant ROI Snapshot
Spray-Adjuvant R&D ROI Snapshot
Estimate saved iterations and lab cost.
Result
Monthly savings = materials saved + technician time saved from reduced iterations.
What Adjuvant Screening Cannot Tell You About Spray Performance
Knowing the limits of any measurement tool is part of using it responsibly.
Use this page to improve adjuvant candidate ranking and incoming-QC gates, not as a substitute for field trials or for final product specifications. The Dropometer is one upstream layer in a spray-formulation development program, not a replacement for the whole program.
Similar wetting and adjuvant-screening workflows
Reduce Spray Drift Through Adjuvant Optimization
A related adjuvant-optimization workflow focusing on drift-reduction through larger-droplet formulation, rather than coverage-wetting optimization alone. Both use contact-angle measurement; this page emphasizes wetting and leaf adhesion, while the drift-reduction page emphasizes surface-tension control for droplet-formation dynamics.
CMC Assessment Techniques for Surfactant Concentration
A related formulation-screening workflow sharing the same concentration-series and candidate-ranking logic for surfactant optimization.
Plasma Treatment Verification for Adhesion & Bonding
A related surface-treatment validation workflow using contact-angle measurement to verify wetting on adherend surfaces before bonding.
How this page was created
Editorial and technical transparency notes for this page.
Drafting assistance
Initial draft created with AI assistance (Claude 4.8 Opus Pro), then rewritten for technical clarity by Droplet Lab Staff
Transparency Note
Technical review and editing by a surface-science specialist for accuracy
Transparency Note
Identifiers, units, thresholds, and key claims checked against cited sources before publication
Transparency Note
Reviewed every 12 months or when underlying standards or instrument specifications change
Report a correction
Spotted an issue in this summary? Send a correction request and our team will review it.
Correction Request
We work hard to keep this standards summary accurate and up to date. If you spot an error (wrong revision/year, missing requirement, incorrect interpretation, or broken link), tell us and we'll review it.
Contact us to report a correction