Surfactant R&D & QC
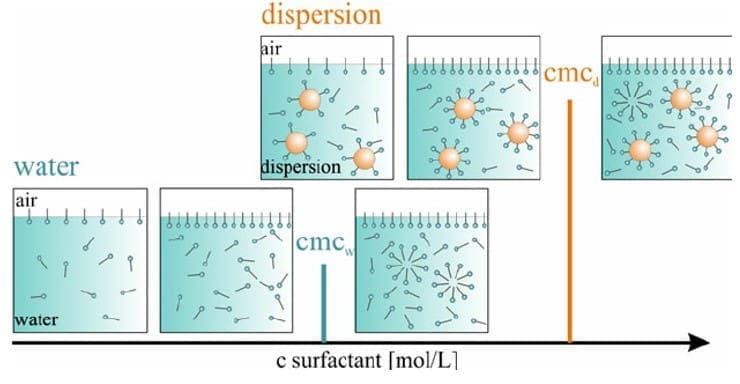
Critical Micelle Concentration (CMC) Assessment Techniques for Surfactant Concentration
Turn CMC determination into fast, repeatable surface tension measurement instead of a one-off lab exercise, and catch a drifting surfactant system before it shows up as an unstable emulsion or foam.
Written by
Gurdeep Singh Saini
Holds a BASc in Mechanical Engineering (Ryerson) and an MASc from York University. He focuses on the custom AI behind the instrument.
COO at Droplet Lab
Read More
Technical Review by
Droplet Lab Team
Droplet Lab builds precision instruments and software for surface science measurement, specialising in contact angle analysis and surface tension characterisation. Used by researchers across materials science, pharmaceuticals, coatings, and advanced manufacturing, Droplet Lab's Dropometer has contributed to studies published in peer-reviewed journals including Advanced Functional Materials (Impact Factor 19). The team combines instrument engineering with deep domain knowledge in wettability science with a focus on practical accuracy.
Read More
Reviewed By
Droplet Lab Team
Droplet Lab builds precision instruments and software for surface science measurement, specialising in contact angle analysis and surface tension characterisation. Used by researchers across materials science, pharmaceuticals, coatings, and advanced manufacturing, Droplet Lab's Dropometer has contributed to studies published in peer-reviewed journals including Advanced Functional Materials (Impact Factor 19). The team combines instrument engineering with deep domain knowledge in wettability science with a focus on practical accuracy.
Validated Measurement Approach
Independent benchmarking and publication-based validation references.
Benchmark Validation
Dropometer contact angle and pendant-drop surface tension methods have been benchmarked against KRÜSS DSA100E reference measurements. The instrument is referenced in peer-reviewed journals including Bioactive Materials (Impact Factor 20) and Advanced Functional Materials (Impact Factor 19).
See peer-reviewed validationBrowse citations
Our instruments are referenced in peer-reviewed journals, theses, and conference publications.
Browse citationsSample CMC Determination: Surface Tension vs. Concentration
Representative output format. Values are illustrative, not a universal specification.
Actual measurement output
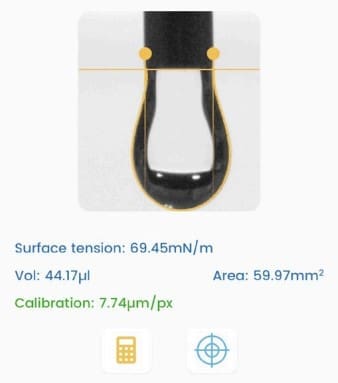
Dropometer pendant-drop surface tension measurement. This is the type of output used to make a formulation release or ranking decision.
The regression line through the declining region and the regression line through the plateau region intersect at approximately 0.5 mM, the estimated CMC for this illustrative series. A batch measured under the same protocol that produces a breakpoint meaningfully shifted from this baseline, without a documented change in temperature or matrix, would be flagged for investigation under the Root Causes above. This output would be included in the surfactant characterization record for this batch or candidate formulation.
Report a correction
Spotted an issue in this summary? Send a correction request and our team will review it.
Correction Request
We work hard to keep this standards summary accurate and up to date. If you spot an error (wrong revision/year, missing requirement, incorrect interpretation, or broken link), tell us and we'll review it.
Contact us to report a correctionSources
1.
KRÜSS Scientific. Critical Micelle Concentration (CMC) and Surfactant Concentration. Know-how glossary. https://www.kruss-scientific.com/en/know-how/glossary/critical-micelle-concentration-cmc-and-surfactant-concentration
2.
Critical micelle concentration. Wikipedia. Overview including temperature and electrolyte dependence of CMC. https://en.wikipedia.org/wiki/Critical_micelle_concentration
3.
Comparative analysis of critical micelle concentration of cationic surfactants determined by conductivity, sound velocity, and density using weighted orthogonal distance regression. ScienceDirect. https://www.sciencedirect.com/science/article/pii/S2468023024017760
4.
Chen, X. et al. Contact angle measurement with a smartphone. Review of Scientific Instruments, 89, 035117 (2018). https://pubs.aip.org/aip/rsi/article-abstract/89/3/035117/368179/Contact-angle-measurement-with-a-smartphone
5.
Fabrico. The Cost of Poor Quality (COPQ) in Manufacturing: 2026 Guide. https://www.fabrico.io/blog/cost-of-poor-quality-copq-manufacturing-guide/
6.
Making Strategy Happen. The Cost of Quality: The 1-10-100 Rule. https://www.makingstrategyhappen.com/the-cost-of-quality-the-1-10-100-rule/