Contents
Emulsion R&D & Formulation QC

Emulsion Stability Mechanism and Phase Separation Control with Emulsifier Efficiency Screening

Reduce emulsion stability risk (creaming, coalescence, phase separation, inversion) by quantifying interfacial surfactant performance early, before a full stability trial tells you it failed.

Who this is for: Formulation chemists, R&D scientists, and QC teams responsible for emulsion stability, water-in-oil and oil-in-water systems, and emulsifier selection.

Positioning: Dropometer does not replace full stability testing (aging, centrifugation, droplet size distribution, rheological properties). It adds fast, quantitative interfacial measurements, surface tension, adsorption kinetics, and wetting, that let you predict and control emulsion stability mechanisms earlier in the workflow.

Last updated
July 12, 2026
Gurdeep-Saini-Photo
Written by
Gurdeep Singh Saini
Holds a BASc in Mechanical Engineering (Ryerson) and an MASc from York University. He focuses on the custom AI behind the instrument.
COO at Droplet Lab
Read More
Droplet-Lab logo
Technical Review by
Droplet Lab Team
Droplet Lab builds precision instruments and software for surface science measurement, specialising in contact angle analysis and surface tension characterisation. Used by researchers across materials science, pharmaceuticals, coatings, and advanced manufacturing, Droplet Lab's Dropometer has contributed to studies published in peer-reviewed journals including Advanced Functional Materials (Impact Factor 19). The team combines instrument engineering with deep domain knowledge in wettability science with a focus on practical accuracy.

Read More
Gurdeep-Saini-Photo
Written By

Gurdeep Singh Saini

COO at Droplet Lab

Holds a BASc in Mechanical Engineering (Ryerson) and an MASc from York University. He focuses on the custom AI behind the instrument.

Droplet-Lab logo
Reviewed By

Droplet Lab Team

Droplet Lab builds precision instruments and software for surface science measurement, specialising in contact angle analysis and surface tension characterisation. Used by researchers across materials science, pharmaceuticals, coatings, and advanced manufacturing, Droplet Lab's Dropometer has contributed to studies published in peer-reviewed journals including Advanced Functional Materials (Impact Factor 19). The team combines instrument engineering with deep domain knowledge in wettability science with a focus on practical accuracy.


The Cost Of Getting It Wrong

15–20%

of annual revenue consumed by Cost of Poor Quality in typical manufacturing operations

American Society for Quality

10×

higher hidden cost vs. visible scrap cost: rework, re-inspection, downtime, and warranty claims are rarely captured

Lean Six Sigma research consensus

$1 → $10

upstream prevention typically saves $10 in internal rework and up to $100 in external warranty and recall costs, for the specific failure modes an upstream screen actually catches

COPQ prevention-to-failure ratio

Sources: ASQ, Learn Lean Sigma, Fabrico COPQ Guide 2026. Figures are industry-wide benchmarks, not Droplet Lab claims. On this page specifically, the "$1" is an interfacial-tension screening run in R&D; the "$10-$100" is a full stability trial, or worse a shipped batch, that fails weeks or months later from a mechanism this screen could have flagged early.

QC-Ready Summary

What this workflow does and what it does not

Quick technical reference for formulation chemists and QA managers evaluating fit before reading further.

Evidence Box (QC-Ready)

Problem this solves

Late discovery of phase separation in emulsions, creaming, coalescence, flocculation, or Ostwald ripening, because interfacial tension and surfactant activity were never quantified early in the workflow.

Dropometer role in workflow

A rapid screening tool to quantify emulsifier surface activity, dynamic interfacial behavior, and wetting, supporting faster emulsification process optimization and QC drift detection. Not a replacement for full stability testing.

Primary outputs

Pendant-drop interfacial and surface tension, static and dynamic
Contact angle for wetting and Pickering-emulsion particle evaluation
Interfacial tension trend versus concentration, including CMC identification

Calibration requirement

Correlate measured interfacial properties to real emulsion stability outcomes (droplet size distribution, viscosity, separation index, shelf life) under your own formulation conditions.

Protocol defaults

Pendant-drop method for interfacial tension measurement
Dynamic mode when adsorption kinetics influence emulsification
Controlled temperature, concentration preparation, and replicate measurements

Known limitation

Surface tension alone does not guarantee a stable emulsion. Rheology, droplet size, and processing conditions also govern stability, and fast transient adsorption events can exceed the camera's frame rate.

Who this is for

What are you trying to solve?

The Dropometer serves four roles across a surfactant characterization program. Each has a different primary risk.

Process Engineer

Investigating batch-to-batch emulsion stability variation on the production line with no clear root cause.

Unexplained process drift

R&D Formulation Chemist

Ranking candidate emulsifier systems by interfacial performance to reduce the number of full reformulation cycles needed to reach a stable formula.

Iteration and lab time cost

QA / QC Manager

Needing a numeric release gate for emulsion batches before they move downstream, to reduce late-stage instability and returns.

Batch inconsistency cost

Compliance Officer

Requiring documented, defensible evidence of formulation screening for NCR responses, CAPA files, or supplier audits.

Audit non-conformance
workflow fit

Is this the right screen for your process?

This is not a universal solution. Check the conditions below before investing further time.

Good fit if

Emulsion failures occur; visible separation, coalescence, or creaming and you need to trace the mechanism
Reformulation cycles are frequent and each one costs real lab time and material
You've documented supplier variability or batch-to-batch drift in emulsifier performance
You need rapid interfacial screening across candidate surfactants or emulsifier systems before committing to a full stability trial
Your QA or compliance process requires a traceable formulation screening record

Less relevant if

Your emulsion system is already well-characterized and stable, with no interfacial variability detected
Your instability is confirmed to trace back to rheology or droplet size rather than interfacial tension; see Honest Scope for why this instrument doesn't screen for that directly
Your regulatory or quality system constraints prohibit introducing a new measurement method without a lengthy validation process you're not prepared to run
Your measurement throughput requirement is extremely high, beyond what a manual per-sample pendant-drop protocol can support
Root Cause Context

Emulsions Are Thermodynamically Unstable. The Question Is How Fast.

Every emulsion wants to separate. Interfacial measurement tells you whether your surfactant system is actually slowing that down, before a full stability trial spends weeks finding out.

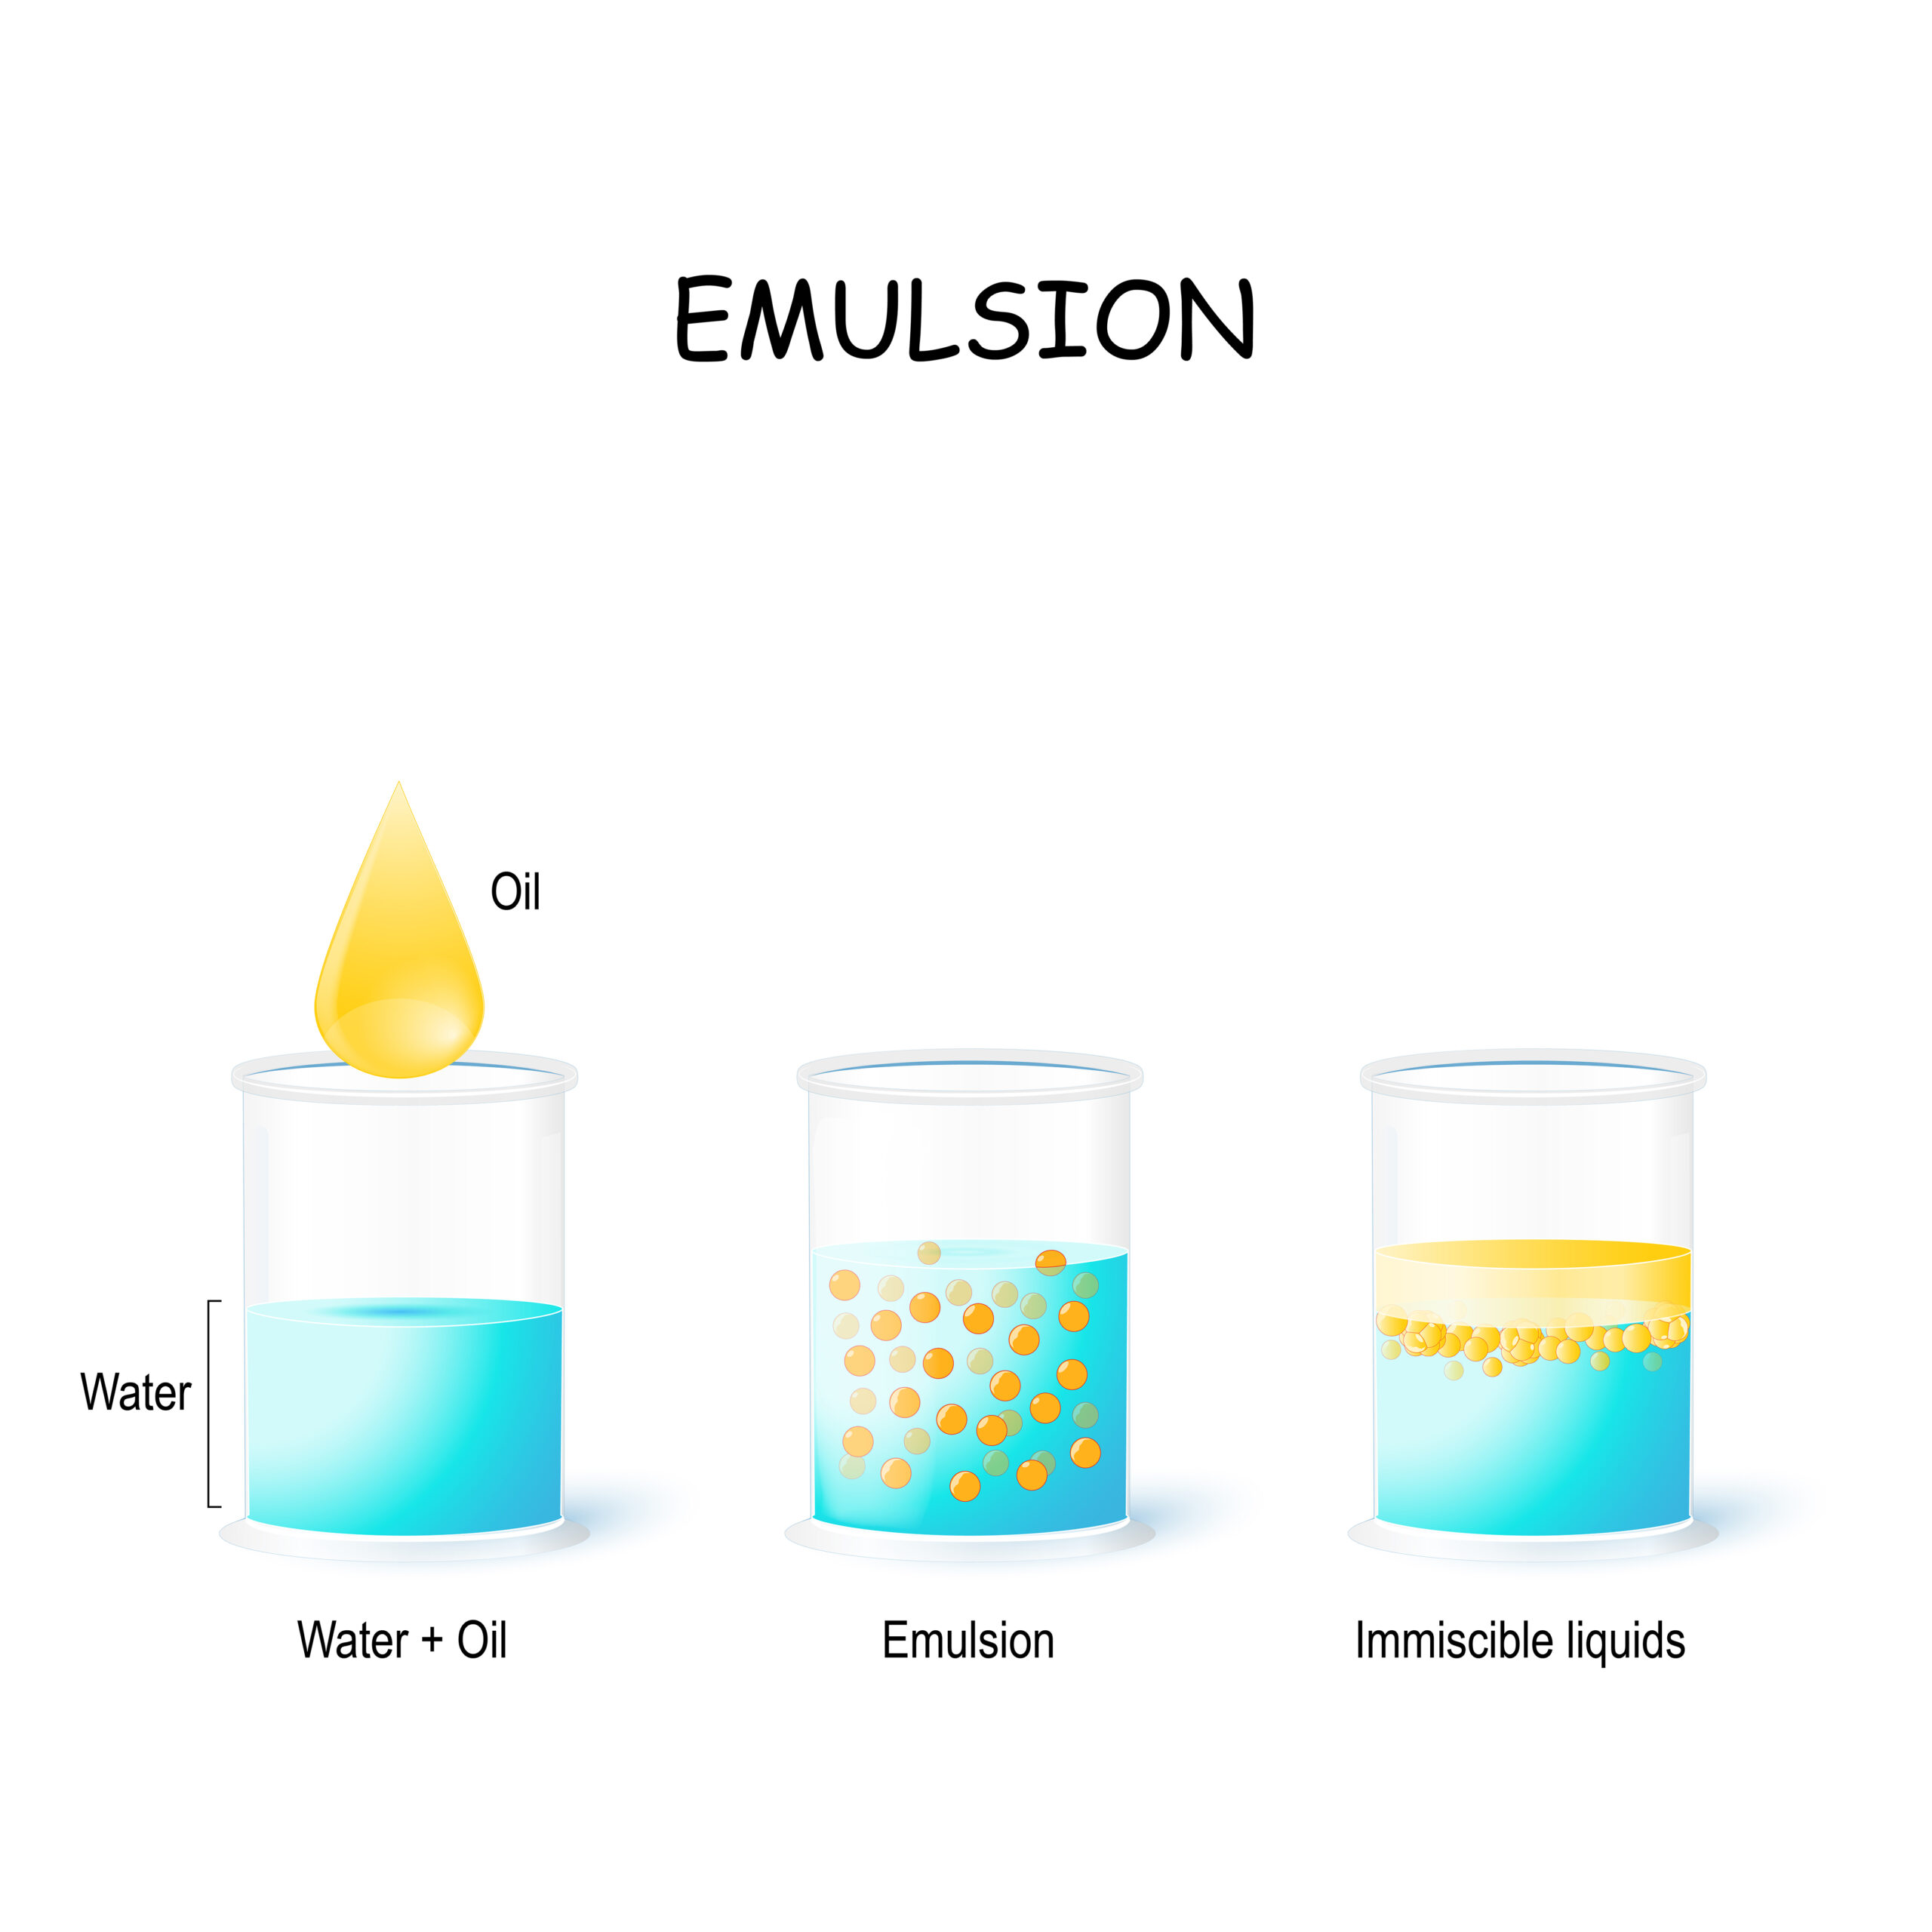
An emulsion is a dispersion of two immiscible liquids, typically oil and water, where one forms the dispersed phase and the other the continuous phase. These systems are thermodynamically unstable — phase separation is the default outcome, and stabilization is what a surfactant system is there to slow down or prevent. Most late-discovered emulsion problems trace back to one of five interfacial mechanisms: inefficient surfactant adsorption, a weak interfacial film prone to coalescence, droplet size and rheology effects that drive creaming even with adequate interfacial tension, or a phase inversion that flips which liquid is the continuous phase.

Interfacial tension and adsorption kinetics measurement gives R&D a way to screen candidate emulsifier systems and catch a weak formulation before it goes into a full stability trial, and gives QC a numeric gate to catch batch-to-batch surfactant drift before it reaches the field. Critical micelle concentration (CMC), hydrophilic-lipophilic balance (HLB), and dynamic surface tension are the standard tools for characterizing surfactant behavior at the interface that this workflow measures directly.

The honest limit: interfacial tension is necessary but not sufficient. Two formulations can have similar surface tension and very different real-world stability, because rheology, droplet size distribution, and interfacial film mechanical strength all matter too and aren't fully captured by a single tension reading. This is an upstream screen that narrows the field and flags likely mechanisms, not a substitute for your full stability protocol.

Recognition

What Does Emulsion Instability Actually Look Like?

Many teams discover an emulsion stability problem only after it's visible, weeks into a shelf-life trial or after a batch has already shipped, without ever having screened the interfacial mechanism that was actually responsible.

Visible phase separation; a cream layer, sedimentation, or oiling off.
Growth of larger droplets over time (consistent with Ostwald ripening or coalescence).
Batch-to-batch variability in emulsion stability despite an unchanged nominal formulation.
Foam collapse or instability in a foaming emulsion system.
Failure after transport or temperature cycling that wasn't apparent at initial QC.
Inconsistent behavior between water-in-oil and oil-in-water systems using nominally the same emulsifier.
Diagnosis

Root Causes

Why:

  • Insufficient reduction of interfacial tension leaves newly formed droplets unstable from the start.

How to detect:

  • Higher surface tension versus your known-good baseline

Corrective action:

  • Optimize surfactant type or concentration Re-screen against CMC to confirm you're dosing in the efficient range

Why:

  • The surfactant can't stabilize newly formed interfaces fast enough during emulsification, even if its equilibrium interfacial tension looks fine.

How to detect:

  • Slow drop in dynamic surface tension over time

Corrective action:

  • Use a faster-adsorbing surfactant or a blend that combines fast initial coverage with strong equilibrium performance

Why:

  • Poor mechanical strength of the interfacial layer leads to coalescence even when the interfacial tension number itself looks acceptable.

How to detect:

  • Similar surface tension across formulations but different real-world stability outcomes

Corrective action:

  • Change emulsifier chemistry, or add polymers or particles to reinforce the interfacial film

Why:

  • Large droplets and low continuous-phase viscosity increase creaming rate independent of interfacial tension.

How to detect:

  • Stable interfacial tension but ongoing separation

Corrective action:

  • Adjust thickener level and rheological properties rather than continuing to iterate on the surfactant alone

Why:

  • A change in composition or conditions flips which liquid is the continuous phase, changing the emulsion's fundamental behavior.

How to detect:

  • A conductivity shift combined with a change in interfacial behavior

Corrective action:

  • Adjust emulsifier HLB and overall formulation balance to restore the intended phase configuration

Not sure which root cause applies to your process?

A surface science specialist can review your stability data and help you identify whether an interfacial screen would add a useful upstream gate.

For Compliance Officers and QA Managers

Building a defensible pre-bond inspection record

Surface tension measurement produces the type of numeric, traceable output that subjective downstream observation cannot. If your quality system requires documented evidence of process control for NCR responses, CAPA files, or supplier audits, CMC and surface tension data provide that evidence in a format your QA documentation already requires.

Audit trail

Numeric surface tension, concentration series, and CMC values with replicate spread, timestamps, and formulation/lot identification; replacing subjective "the emulsion looked unstable" notes with defensible numeric logs.

CAPA evidence

When a downstream instability issue triggers a Corrective and Preventive Action file, CMC and surface tension trend data provide quantitative before/after evidence of the surfactant system's condition, not anecdotal description.

NCR documentation

Non-conformance reports that include numeric CMC and surface tension data allow you to assign root cause to concentration, ionic strength, temperature, or measurement error with evidence, not inference.

Supplier qualification

Incoming surfactant lot inspection using CMC and surface tension measurement provides a numeric acceptance criterion for supplier qualification, independent of the supplier's own published values.

Process control records

CMC and surface tension trend logs demonstrate statistical process control at the formulation step; relevant to Six Sigma, SPC, and DMAIC programs targeting instability-driven COPQ.

Formulation ranking record

A concentration-series comparison across candidate surfactants gives R&D a numeric basis for gating which formulation advances, instead of a downstream pass/fail on the finished emulsion or foam.

What to Measure

Primary screen

Surface Tension vs Concentration

Why it matters: Measures surfactant efficiency at the interface.

How to interpret: Lower values indicate stronger interfacial activity.

When it is not enough: Doesn't by itself confirm real-world emulsion stability.

Primary screen

Critical micelle concentration (CMC)

Why it matters: Identifies the efficient concentration range for the surfactant, preventing overuse.

How to interpret: Guides cost-performance balance in the formulation.

When it is not enough: CMC identifies where micelles form, not necessarily the optimal formulation dose.

Kinetics

Dynamic surface tension

Why it matters: Tracks adsorption kinetics, critical for how well a surfactant stabilizes freshly formed interfaces during emulsification and foam formation.

How to interpret: A faster drop toward equilibrium generally supports better emulsification.

When it is not enough: A different phenomenon from equilibrium surface tension; don't substitute one for the other.

Supplementary

Contact angle

Why it matters: Measures wetting behavior, important for solid particles in Pickering emulsion systems.

How to interpret: Particle wettability at the oil-water interface governs whether it can stabilize a Pickering emulsion at all.

When it is not enough: Relevant specifically to particle-stabilized systems, not conventional surfactant-stabilized emulsions.

Complementary, not measured by Dropometer

Droplet size distribution, rheology, and conductivity

Why it matters: Droplet size and viscosity govern creaming and coalescence rate; conductivity identifies which phase is continuous.

How to interpret: Used alongside interfacial data to correlate a measured mechanism with an actual stability outcome.

When it is not enough: These are separate analytical methods, not Dropometer outputs; track them alongside interfacial data, not as a substitute for it.

Validated Measurement Approach

Independent benchmarking and publication-based validation references.

Benchmark Validation

Dropometer contact angle and pendant-drop surface tension methods have been benchmarked against KRÜSS DSA100E reference measurements. The instrument is referenced in peer-reviewed journals including Bioactive Materials (Impact Factor 20) and Advanced Functional Materials (Impact Factor 19).

See peer-reviewed validation

Publication Evidence

Our instruments are referenced in peer-reviewed journals, theses, and conference publications.

Browse citations
QC Protocol

How Dropometer Fits Your Workflow

Dropometer is best used to screen candidate emulsifier systems in R&D and as a batch release gate once a formulation is in production.

1

Identify the failure mechanism

Determine whether instability arises from coalescence, flocculation, creaming, or Ostwald ripening: Use the Root Causes signal pattern to narrow the mechanism before screening

2

Screen interfacial performance

Measure interfacial tension across a concentration series and rank candidate emulsifier systems: Identify CMC to confirm you're comparing systems in their efficient dosing range

3

Analyze adsorption kinetics

Use dynamic surface tension measurements to evaluate real-time stabilization behavior: Correlate interfacial metrics with actual stability data (aging, centrifugation, droplet size) from your own trials

4

Deploy QC gates

Establish PASS / MONITOR / FAIL thresholds for production release: PASS: within baseline band → release for next process step MONITOR: borderline result → re-prepare and re-measure FAIL: out of band → hold and troubleshoot using the Root Causes signal pattern

We completed our gage R&R study on the unit and it performed very well.

Brandon Barbee

Corporate Quality Engineer - Zeus Industries - Polymer Manufacturing

Download the Emulsion Stability Screening SOP Template

An editable SOP template your team can adapt for your emulsifier system, oil phase, and stability targets. Includes measurement protocol, gate-setting guidance, and a QC log format ready for your documentation system.

Example Outputs

Sample Emulsifier Screening: Interfacial Tension Across Candidate Systems

Representative output format. Values are illustrative, not a universal specification.

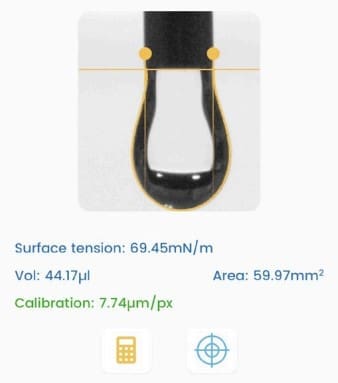
Actual measurement output

Dropometer pendant-drop surface tension measurement. This is the type of output used to make a formulation release or ranking decision.

Surface Tension Measurement

Sample Emulsifier Screening: Interfacial Tension Across Candidate Systems

Candidate System Equilibrium Interfacial Tension (mN/m) Time to 90% of Equilibrium (s) 30-Day Stability Outcome
Emulsifier A, at CMC 4.8 12 Stable
Emulsifier B, at CMC 5.1 14 Stable
Emulsifier C, at CMC 5.0 95 Coalescence observed
Emulsifier D, at CMC 9.6 22 Creaming observed
Emulsifier A, below CMC 11.2 18 Not tested, screened out

Emulsifier C shows a near-identical equilibrium interfacial tension to Emulsifiers A and B, but a much slower approach to equilibrium — this is exactly the slow-adsorption-kinetics root cause, and it correctly predicted the coalescence seen in the 30-day trial despite a good equilibrium number. Emulsifier D's higher equilibrium tension flagged it as a weaker candidate before the stability trial confirmed creaming. Emulsifier A below its CMC was screened out at the interfacial stage and never entered a full trial, saving that iteration. This output would be included in the formulation screening record used to select which candidate advances.

Troubleshooting

Emulsion stability troubleshooting guide

Start condition: emulsion instability, phase separation, or batch-to-batch variability is occurring. Use the signal pattern to identify the most likely mechanism.

Signal A

Higher surface tension versus baseline

Likely cause: Poor surfactant efficiency.
Action: Optimize surfactant type or concentration; re-screen against CMC to confirm efficient dosing.

Signal B

Slow drop in dynamic surface tension

Likely cause: Slow adsorption kinetics; the surfactant can't stabilize newly formed interfaces fast enough. Action: Switch to a faster-adsorbing surfactant or a blend.

Signal C

Similar surface tension, different stability outcomes

Likely cause: Weak interfacial film prone to coalescence despite acceptable tension.
Action: Change emulsifier chemistry, or reinforce the interfacial film with polymers or particles.

Signal D

Stable interfacial tension but ongoing separation

Likely cause: Droplet size and rheology effects driving creaming independent of interfacial tension.
Action: Adjust thickener level and rheological properties rather than the surfactant.

Signal E

Conductivity shift combined with an interfacial change

Likely cause: Phase inversion — the continuous phase has flipped.
Action: Adjust emulsifier HLB and formulation balance to restore the intended phase configuration.

FAQ

Common questions before adoption

No. Interfacial tension is necessary but not sufficient — rheology, droplet size distribution, and interfacial film strength also govern stability. This screen narrows the likely mechanism; it doesn't replace a full stability trial.

There is no universal threshold. Optimal values depend on emulsion type (oil-in-water vs. water-in-oil), oil phase, temperature, and processing conditions — calibrate your own gate against your own stability outcomes.

Not necessarily. CMC identifies where micelles start forming, not automatically the optimal formulation dose — efficient dosing may be above or below CMC depending on your performance objectives.

The signal pattern (which metric moved, and how) narrows the cause to surfactant efficiency, adsorption kinetics, interfacial film strength, droplet size/rheology, or phase inversion, per the Root Causes and Troubleshooting sections.

Partially. Contact angle measurement of the particle at the oil-water interface is relevant to Pickering emulsion stabilization; the interfacial tension protocol itself is built around conventional surfactant systems.

No. Those are separate analytical methods this page explicitly treats as complementary, not Dropometer outputs — track them alongside interfacial data, not instead of it.

Yes. The Dropometer produces numeric interfacial tension, CMC, and dynamic adsorption data with replicate records, timestamps, and formulation identification, usable in NCR responses, CAPA files, and supplier audit packages.

Business Impact

What Changes When You Screen the Interface, Not Just the Finished Emulsion

Before and with Dropometer; operational outcomes

Metric Before Dropometer With Dropometer Indicative Benchmark
Failure discovery point Weeks into a full stability trial, or after shipment Interfacial screening before committing to a full trial "COPQ from late-discovered defects typically 15–20% of revenue for manufacturers without upstream gates"
Reformulation cycle cost A full stability trial per candidate emulsifier Interfacial screening narrows candidates before a full trial is run "Reduced reformulation cycles is the outcome this page's own audience already states"
Mechanism identification Trial-and-error across five possible instability mechanisms Signal pattern narrows to surfactant efficiency, kinetics, film strength, rheology, or inversion within one screening run "Structured data-driven diagnosis vs. iterative trial-and-error"
Batch-to-batch consistency Unmeasured supplier or lot-to-lot emulsifier variability Tracked per batch against an interfacial baseline "Replicate spread detects supplier drift before it reaches a full batch"
Audit documentation Subjective downstream observation; not defensible under audit Numeric interfacial tension and CMC logs with timestamps and lot ID "Applicable to NCR, CAPA, incoming inspection, and supplier qualification records"

Instant ROI Snapshot

Emulsion Stability R&D ROI Snapshot

Estimate saved iterations and lab cost.

Each Dropometer unit is $5,000 — default models 1 unit.
Oil/water phase and emulsifier cost per formulation trial.
Prep, pendant-drop interfacial tension, and analysis.
Conservative range: 25-40% at this instrument cost.

Result

~0
Iterations saved / month
~0
Monthly savings
~0
Payback period
~0
Year-1 net benefit

Monthly savings = materials saved + technician time saved from reduced iterations.

Honest scope

What Interfacial Tension Measurement Cannot Tell You

Knowing the limits of any measurement tool is part of using it responsibly.

No universal surface tension threshold exists for emulsion stability — optimal values depend on emulsion type, oil phase, temperature, and processing conditions.
CMC does not equal optimal formulation dose; CMC identifies where micelles form, and efficient dosing may be above or below that point depending on your performance objectives.
Rheology and droplet size remain critical — interfacial tension alone cannot predict creaming or sedimentation rate if viscosity is low or droplet size is large.
Experimental conditions must be controlled — temperature, pH, ionic strength, and equipment geometry all need to stay consistent across measurements for results to be comparable.
Fast transient adsorption events can exceed the camera's frame rate, which limits resolution of very fast kinetics.
Use interfacial metrics as an upstream quality gate, then confirm final suitability with your established emulsion stability acceptance tests (aging, centrifugation, separation index, shelf-life monitoring).

Use this page to improve formulation screening and upstream troubleshooting, not to replace full stability testing. The Dropometer is one layer in a quality system, not a substitute for one.

How this page was created

Editorial and technical transparency notes for this page.

Transparency Details 4 checklist items
01

Drafting assistance

Initial draft created with AI assistance (Claude 4.8 Opus Pro), then rewritten for technical clarity by Droplet Lab Staff

02

Transparency Note

Technical review and editing by a surface-science specialist for accuracy

03

Transparency Note

Identifiers, units, thresholds, and key claims checked against cited sources before publication

04

Transparency Note

Reviewed every 12 months or when underlying standards or instrument specifications change

Report a correction

Spotted an issue in this summary? Send a correction request and our team will review it.

Correction Request

We work hard to keep this standards summary accurate and up to date. If you spot an error (wrong revision/year, missing requirement, incorrect interpretation, or broken link), tell us and we'll review it.

Contact us to report a correction
References

Sources

1.
Chen, X. et al. Contact angle measurement with a smartphone. Review of Scientific Instruments, 89, 035117 (2018). https://pubs.aip.org/aip/rsi/article-abstract/89/3/035117/368179/Contact-angle-measurement-with-a-smartphone
2.
Fabrico. The Cost of Poor Quality (COPQ) in Manufacturing: 2026 Guide. https://www.fabrico.io/blog/cost-of-poor-quality-copq-manufacturing-guide/
3.
Making Strategy Happen. The Cost of Quality: The 1-10-100 Rule. https://www.makingstrategyhappen.com/the-cost-of-quality-the-1-10-100-rule/
4.
Surface tension measurement with a smartphone using a pendant drop. Colloids and Surfaces A: Physicochemical and Engineering Aspects. https://www.sciencedirect.com/science/article/abs/pii/S0927775717307744