Foam Control and Foam Quality Tuning with Surfactant Efficiency and Emulsion Stability
Tune foam up or down, predictably, by measuring the surface-active signals that actually drive foam formation, drainage, and batch variability.
Who this is for: Formulation chemists, process engineers, and QA/QC teams in home and personal care, industrial cleaning, coatings, agrochemicals, food and beverage, and pharmaceutical manufacturing.
Positioning: Dropometer does not replace traditional foam measurement (foam column, Ross-Miles, or application testing). It adds rapid, quantitative surface tension and wetting data that predict foam characteristics, reducing trial-and-error and enabling more precise surfactant selection.
Droplet Lab Team
Droplet Lab builds precision instruments and software for surface science measurement, specialising in contact angle analysis and surface tension characterisation. Used by researchers across materials science, pharmaceuticals, coatings, and advanced manufacturing, Droplet Lab's Dropometer has contributed to studies published in peer-reviewed journals including Advanced Functional Materials (Impact Factor 19). The team combines instrument engineering with deep domain knowledge in wettability science with a focus on practical accuracy.

The Cost Of Getting It Wrong
10×
higher hidden cost vs. visible scrap cost: rework, re-inspection, downtime, and warranty claims are rarely captured
Lean Six Sigma research consensus
$1 → $10
upstream prevention typically saves $10 in internal rework and up to $100 in external warranty and recall costs, for the specific failure modes an upstream screen actually catches
COPQ prevention-to-failure ratio
Sources: ASQ, Learn Lean Sigma, Fabrico COPQ Guide 2026. Figures are industry-wide benchmarks, not Droplet Lab claims. On this page specifically, uncontrolled foam is a two-sided cost: too much foam causes product loss and downtime during processing, while too little foam ruins a product designed to foam on purpose. Both are R&D iteration costs caught early rather than a factory-floor recall.
What this workflow does and what it does not
Quick technical reference for formulation chemists and QA managers evaluating fit before reading further.
Evidence Box (QC-Ready)
Uncontrolled foam levels causing product loss, downtime, inconsistent foam quality, or manufacturing defects, without a quantitative way to predict foam behavior ahead of a full foam test.
A fast QC and R&D tool quantifying surface-active behavior to predict foam formation, stability, and drainage. Not a replacement for traditional foam measurement (foam column, Ross-Miles, or application testing).
Surface tension, static and dynamic, via pendant drop
Contact angle for wetting and film behavior
Surface energy for substrate interaction, where relevant to a coating or cleaning application
Correlate surface tension and dynamic adsorption metrics with foam production KPIs (foam height, drainage, bubble diameter, foam stability).
Run a concentration series to map surfactant efficiency
Use a fixed surface age for dynamic measurements
Minimum 5 replicates for statistical reliability
Foam behavior also depends on process turbulence and air pressure that this protocol doesn't simulate. Surface tension alone does not fully define foam characteristics; it's a strong predictive indicator, not a complete model.
What are you trying to solve?
The Dropometer serves four roles across a foam control program. Each has a different primary risk, and note that "success" points in opposite directions depending on which one you're in. Jump to yours.
Process Engineer (Foam Reduction)
Fighting excess foam during mixing, filling, or transport that's causing product loss or downtime, and needing to know which surfactant or additive change will actually fix it.
R&D Formulator (Foam Performance)
Optimizing a product designed to foam (personal care, beverage) for consistent foam height and stability, ranking candidate surfactants by measured performance instead of trial batches.
QA / QC Manager
Needing a numeric release gate to catch batch-to-batch foam inconsistency before it reaches a customer or a downstream process step.
Compliance Officer
Requiring documented, defensible evidence of surfactant and foam-control formulation decisions for NCR responses, CAPA files, or supplier audits.
Is this the right screen for your process?
This is not a universal solution. Check the conditions below before investing further time.
Good fit if
Less relevant if
Whether you're trying to kill foam or keep it, the same surface-active measurements predict which way your formulation will behave.
What this page helps you decide quickly
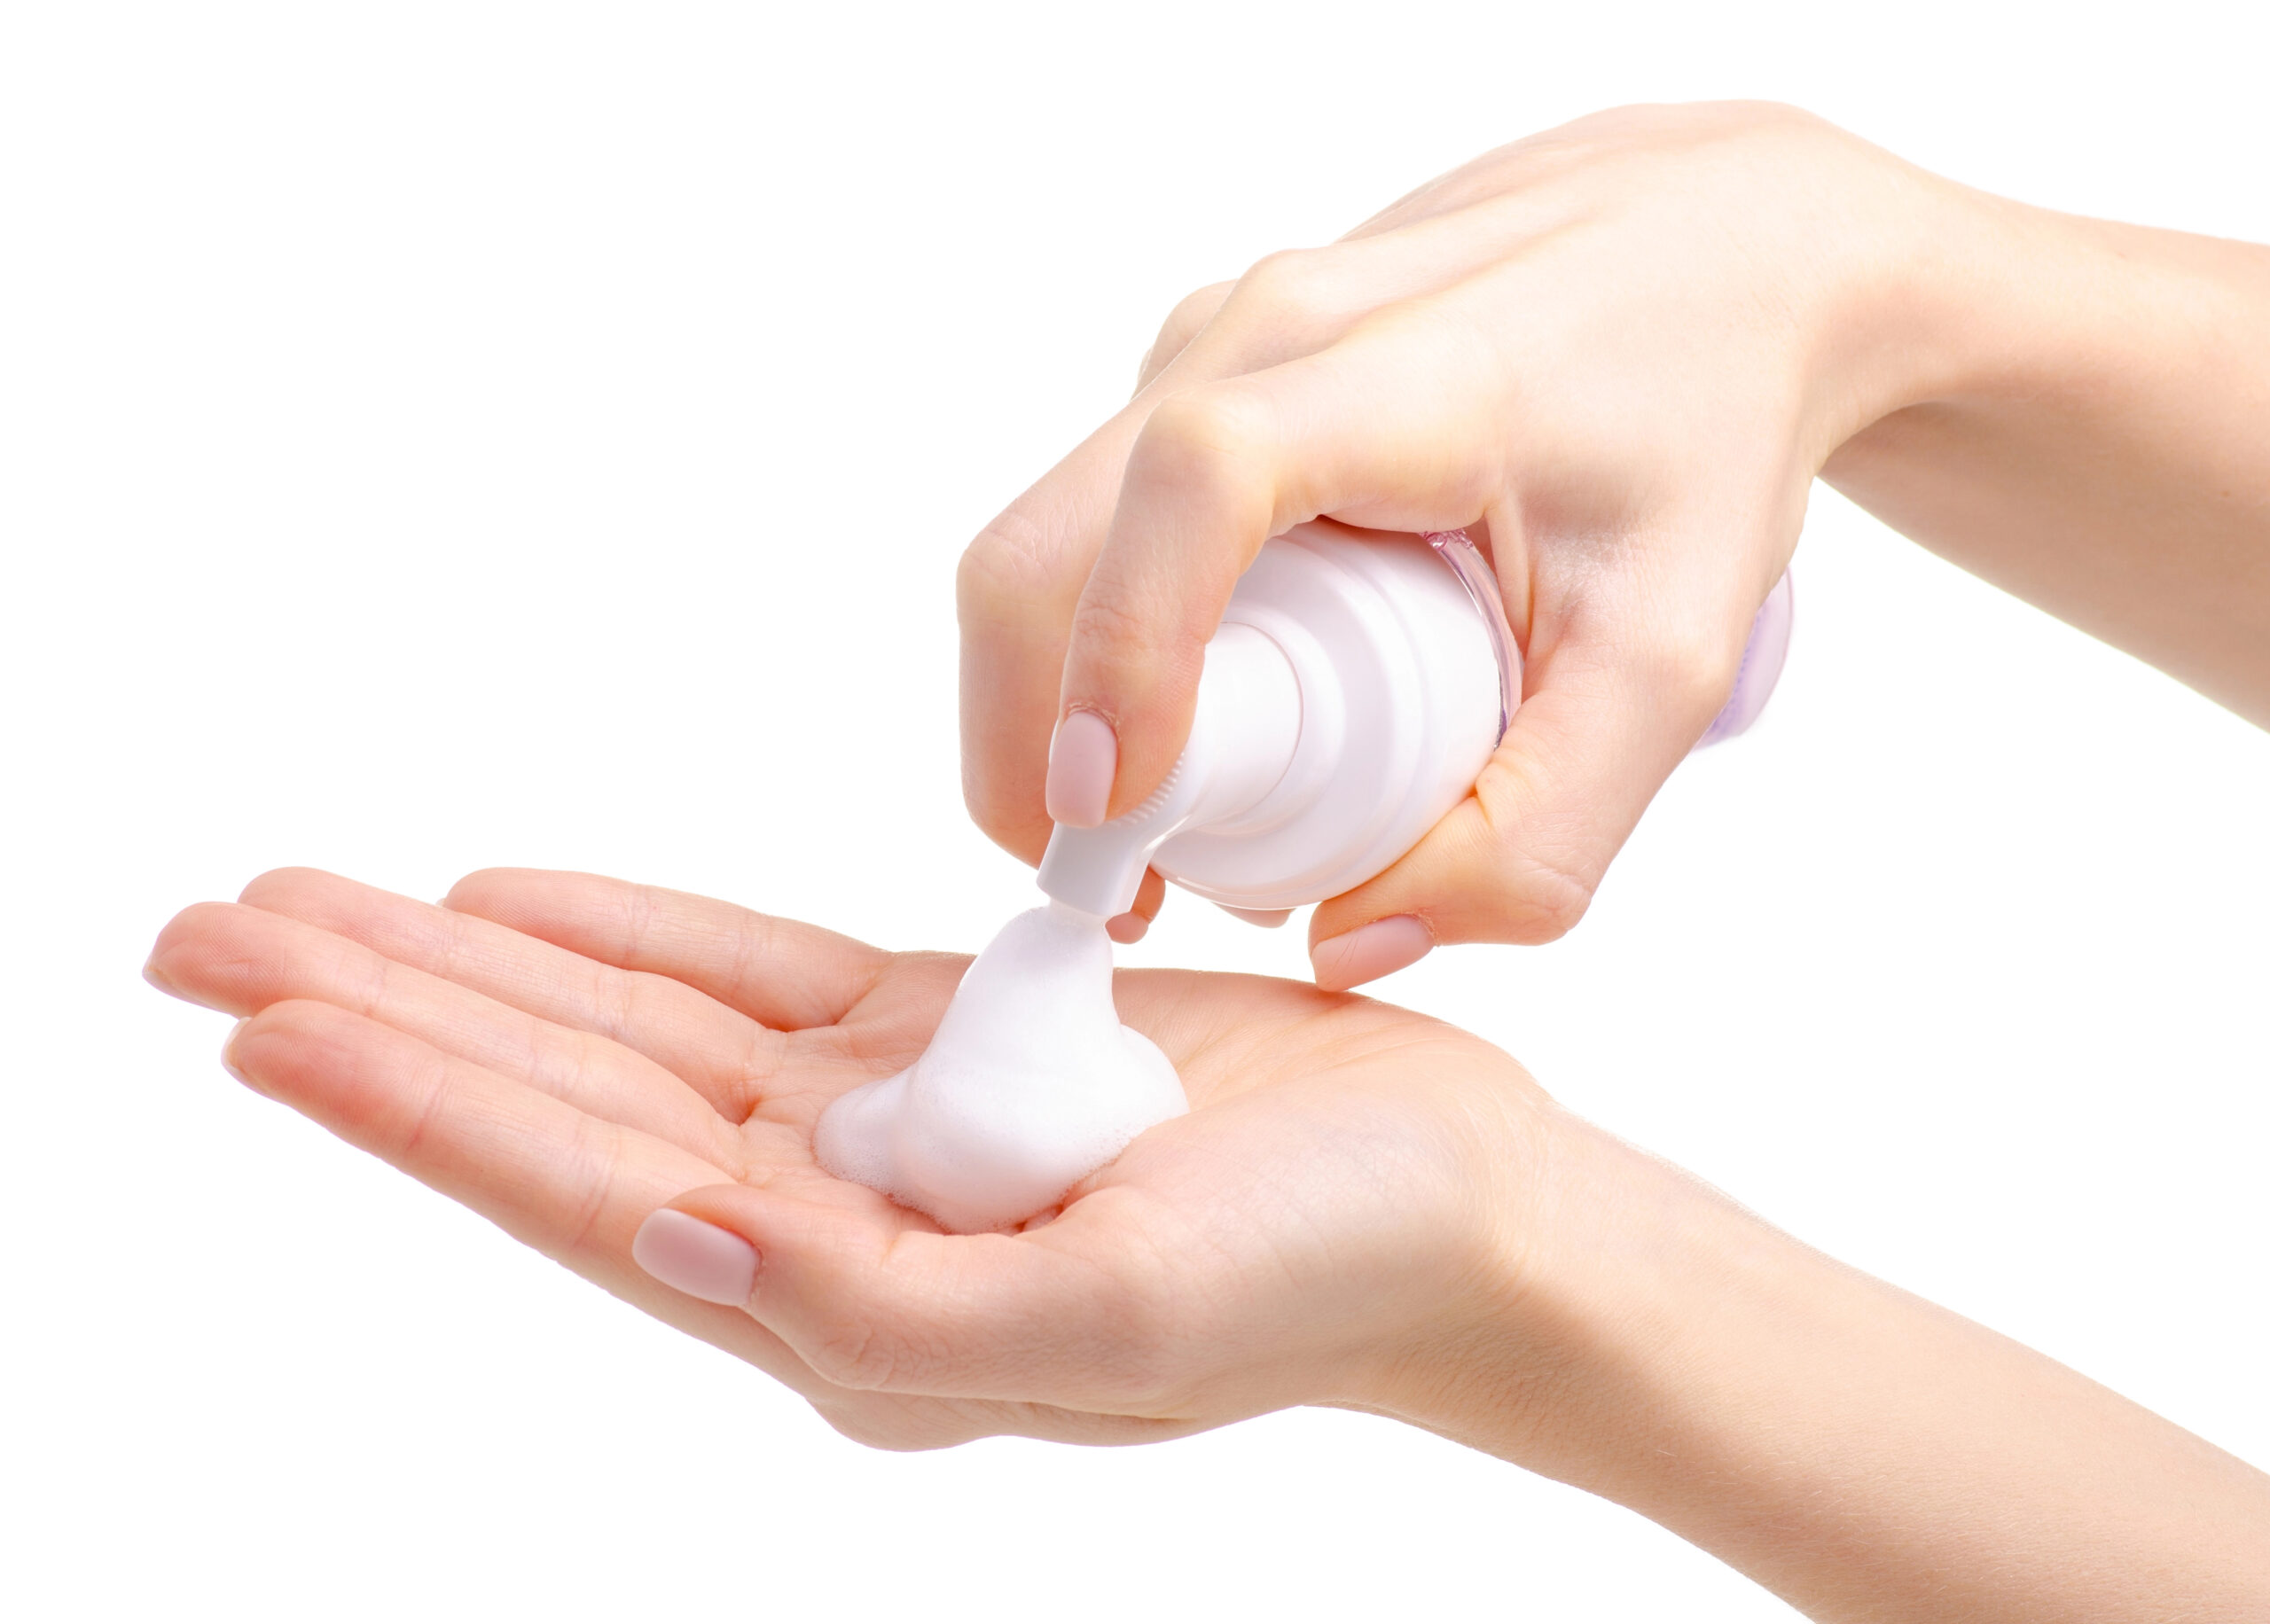
Foam control matters in both directions. Beverage processing, fermentation, coatings, pharmaceutical liquids, and pulp and paper manufacturing all need to suppress unwanted foam that reduces throughput and creates operational inefficiency. Personal care and cleaning products need the opposite: a foam that forms readily, looks right, and holds its structure. Both problems are governed by the same underlying surface-active behavior, just optimized toward opposite targets.
Foam film stability depends on Gibbs elasticity and the Marangoni effect: when a foam film is stretched or disturbed, a local surfactant concentration gradient forms, creating a surface tension gradient that pulls liquid back into the thinning spot and resists film rupture. A formulation with poor surface elasticity at the operating concentration produces a foam that collapses quickly, whether or not that's the goal. Surfactant concentration near the CMC, water quality and electrolyte content, and any defoamer or antifoam additives all shift this behavior, sometimes in ways that trade one problem for another (an antifoam that kills foam but destabilizes an emulsion elsewhere in the formulation, for instance).
This workflow measures surface tension and adsorption kinetics directly, so you can predict which direction a formulation change will push foam behavior before running a full foam test. The honest limit: surface tension is a strong predictive indicator, not a complete model. Foam behavior in a real process also depends on turbulence, air entrainment, and equipment geometry that this protocol doesn't simulate — this narrows your formulation search, it doesn't replace your foam column or application test.
What Does Foam Control Failure Actually Look Like?
Many teams either fight excess foam with an ever-increasing dose of antifoam, or chase inconsistent foam performance in a product that's supposed to foam, without ever measuring the surface-active behavior actually driving it.
Root Causes
Why:
- Small concentration changes near the critical micelle concentration have an outsized impact on both surface tension and foam formation.
How to detect:
- A shift in the surface-tension-versus-concentration curve relative to your baseline
Corrective action:
- Re-optimize concentration specifically for your foam control target, referencing your own CMC characterization
Why:
- Water hardness and electrolyte content affect adsorption kinetics and foam stability, independent of the surfactant's nominal concentration.
How to detect:
- Dynamic surface tension changes between water sources or batches
Corrective action:
- Standardize aqueous system composition and water source
Why:
- Additives used to suppress foam can introduce side effects, including destabilizing an emulsion elsewhere in the formulation.
How to detect:
- Increased variability in surface tension or emulsion-related measurements after an additive change
Corrective action:
- Optimize additive levels for balanced foam control rather than maximizing suppression alone
Why:
- Some systems need essentially no foam; others need stable, structured foam using a surfactant selected for the wrong target produces a mismatch.
How to detect:
- A mismatch between measured surface tension behavior and actual foam behavior in application testing
Corrective action:
- Select surfactant based on measured adsorption performance against your specific foam target, not a generic "good foamer" reputation
Why:
- If surface tension and adsorption behavior measure as expected but foam performance in the real process still doesn't match, the cause may be process turbulence, air entrainment, or equipment geometry rather than formulation chemistry.
How to detect:
- Lab-scale surface tension measurements are consistent while real-process foam behavior remains inconsistent
Corrective action:
- Review process mechanical parameters (mixing speed, air introduction point, equipment geometry) rather than continuing to iterate on the formulation alone
Not sure which root cause applies to your process?
A surface science specialist can review your foam performance history and help you identify whether a surface-tension screen would add a useful upstream gate.
Building a defensible pre-bond inspection record
Surface readiness measurement produces the type of numeric, traceable output that a subjective "the foam looked off" observation cannot. If your quality system requires documented evidence of process control for NCR responses, CAPA files, or supplier audits, surface tension and dynamic adsorption data provide that evidence in a format your QA documentation already requires.
Audit trail
Numeric surface tension, dynamic adsorption, and variability values with replicate spread, timestamps, and formulation/lot identification; replacing subjective foam-quality notes with defensible numeric logs.
CAPA evidence
When a foam-related product loss, downtime event, or foam-quality complaint triggers a Corrective and Preventive Action file, surface tension and adsorption data before and after a formulation or additive change provide quantitative evidence of the mechanism involved, not anecdotal description.
NCR documentation
Non-conformance reports that include numeric surface-active data allow you to assign root cause to surfactant concentration, water quality, additive interaction, or surfactant selection with evidence, not inference.
Supplier qualification
Incoming surfactant or defoamer lot inspection using surface tension measurement provides a numeric acceptance criterion for supplier qualification, independent of the supplier's own published values.
Process control records
Surface tension and dynamic adsorption trend logs demonstrate statistical process control at the formulation step; relevant to Six Sigma, SPC, and DMAIC programs targeting foam-driven COPQ.
Formulation screening record
A concentration-series comparison across candidate surfactant systems gives R&D a numeric basis for gating which formulation advances to a full foam trial, instead of a downstream pass/fail on the finished product.
What to Measure
Surface Tension vs Concentration
Why it matters: Indicates surfactant efficiency
How to interpret: Helps optimize formulation and reduce surfactant consumption while hitting your foam target.
When it is not enough: Doesn't by itself predict real-process foam behavior under turbulence.
Dynamic Surface Tension
Why it matters: Captures real-time surfactant adsorption behavior during foam generation.
How to interpret: Critical for processes involving agitation or turbulence, where equilibrium surface tension alone won't predict behavior.
When it is not enough: A lab-scale proxy, not a substitute for a full-process foam test.
Variability (Batch Consistency)
Why it matters: Detects instability or contamination between batches.
How to interpret: Higher variability versus your baseline signals a formulation or water-quality drift worth investigating.
When it is not enough: Flags inconsistency without identifying which root cause is responsible.
Wetting and film formation (contact angle)
Why it matters: Relevant for coating and cleaning applications where foam interacts with a substrate surface.
How to interpret: Evaluates surface interaction behavior alongside the foam-specific measurements above.
When it is not enough: Not directly a foam stability metric on its own; most relevant when foam performance and substrate wetting both matter.
Validated Measurement Approach
Independent benchmarking and publication-based validation references.
Benchmark Validation
Dropometer contact angle and pendant-drop surface tension methods have been benchmarked against KRÜSS DSA100E reference measurements. The instrument is referenced in peer-reviewed journals including Bioactive Materials (Impact Factor 20) and Advanced Functional Materials (Impact Factor 19).
See peer-reviewed validationPublication Evidence
Our instruments are referenced in peer-reviewed journals, theses, and conference publications.
Browse citationsHow Dropometer Fits Your Workflow
Dropometer is best used to build a surfactant efficiency curve toward your specific foam target, whether that target is suppression or stability.
Define foam requirements
Decide the direction: reduce foam (industrial, pharma) or increase and stabilize foam (beverage, personal care): This determines whether you're screening for weak or strong surface elasticity at your operating concentration
Build surfactant efficiency curve
Measure surface tension across a concentration series: Identify the optimal concentration relative to CMC for your specific foam target
Measure dynamic behavior
Capture adsorption rate, which drives real-world foam formation under agitation: Compare candidate surfactants or additive levels on dynamic, not just equilibrium, surface tension
Establish QC gates
Set PASS / MONITOR / FAIL thresholds based on measured parameters, correlated to your own foam production KPIs: PASS: within baseline band → release for next process step MONITOR: borderline result → re-prepare and re-measure FAIL: out of band → hold and troubleshoot using the Root Causes signal pattern
We completed our gage R&R study on the unit and it performed very well.
Brandon Barbee
Corporate Quality Engineer - Zeus Industries - Polymer Manufacturing
Download the Foam Control Screening SOP Template
An editable SOP template your team can adapt for your foam target, surfactant system, and process. Includes measurement protocol, gate-setting guidance, and a QC log format ready for your documentation system.
Sample Surfactant Screening: Foam Suppression vs. Foam Stabilization Targets
Representative output format. Values are illustrative, not a universal specification.
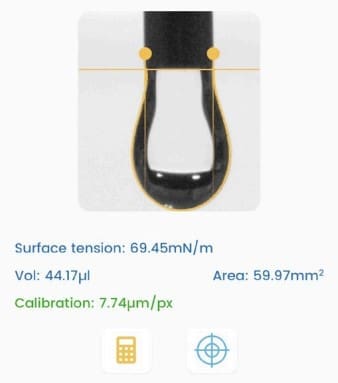
Dropometer pendant-drop dynamic surface tension measurement. This is the type of output used to select a surfactant candidate for a specific foam target.
Sample Surfactant Screening: Foam Suppression vs. Foam Stabilization Targets
| Candidate System | Equilibrium Surface Tension (mN/m) | Dynamic Adsorption (Time to 90% Equilibrium, s) | Foam Target Fit |
|---|---|---|---|
| Surfactant A, at target concentration | 28.4 | 8 | Fast-adsorbing, fits suppression target |
| Surfactant B, at target concentration | 27.9 | 65 | Slow-adsorbing, poor fit for suppression |
| Surfactant C, at target concentration | 31.2 | 6 | High elasticity signature, fits stabilization target |
| Surfactant C + antifoam, at test dose | 31.5 | 7 | Elasticity signature disrupted, check emulsion stability separately |
Surfactant A's fast adsorption rate makes it a stronger candidate where the goal is minimal foam persistence during agitation. Surfactant B has a similar equilibrium surface tension to A but adsorbs far more slowly, meaning it would likely underperform as a defoamer despite looking comparable on a static reading alone. Surfactant C shows the elasticity signature associated with stable foam and is a stronger candidate for a foam-positive product; adding antifoam to that same system for an unrelated purpose visibly disrupts that signature, flagging a formulation conflict worth investigating before it shows up as an inconsistent finished product. This output would be included in the surfactant screening record used to select which candidate advances.
Foam control troubleshooting guide
Start condition: foam levels are inconsistent, excessive, or insufficient relative to your target. Use the signal pattern to identify the most likely cause.
Shift in the surface-tension-versus-concentration curve
Likely cause: Surfactant concentration has drifted near the CMC, where small changes have an outsized effect.
Action: Re-optimize concentration for your specific foam target, referencing your own CMC characterization.
Dynamic surface tension changes between batches
Likely cause: Water quality or electrolyte content differences affecting adsorption kinetics.
Action: Standardize aqueous system composition and water source.
Increased variability after an additive change
Likely cause: A defoamer, antifoam, or oil additive is introducing side effects, potentially including emulsion instability elsewhere in the formulation.
Action: Optimize additive levels for balanced foam control rather than maximizing suppression alone.
Mismatch between measured surface tension and actual foam behavior
Likely cause: Surfactant selection mismatch chosen for the wrong foam target.
Action: Re-select surfactant based on measured adsorption performance against your specific target, not a generic reputation.
Common questions before adoption
No. It's an upstream screen that predicts foam-driving surface behavior and narrows your candidate list before a full foam test, not a replacement for that test.
It predicts the direction based on surface tension, dynamic adsorption, and elasticity signature, correlated against your own foam production data. It's a strong predictive indicator, not a guarantee, since process turbulence and equipment geometry also matter.
Not necessarily, and it can introduce side effects like destabilizing an emulsion elsewhere in the formulation. This screen helps you find the balance point rather than just maximizing antifoam dose.
Yes. Comparing equilibrium surface tension and dynamic adsorption rate across candidates at matched concentration is one of the more direct uses of this protocol.
Yes. Water hardness and electrolyte content affect adsorption kinetics and foam stability independent of the surfactant's nominal concentration this is a documented root cause, not a hypothetical one.
Partially. Dynamic surface tension is the more relevant metric for fast processes, but real-process turbulence and air entrainment still diverge from a lab-scale measurement treat this as a screen, not a final process simulation.
Yes. The Dropometer produces numeric surface tension, dynamic adsorption, and variability data with replicate records, timestamps, and formulation identification, usable in NCR responses, CAPA files, and supplier audit packages.
What Changes When You Predict Foam Behavior Instead of Testing It Blind
Before and with Dropometer; operational outcomes
| Metric | Before Dropometer | With Dropometer | Indicative Benchmark |
|---|---|---|---|
| Failure discovery point | A full foam test or a production run, after committing lab time or a batch | Surface tension and dynamic adsorption screening before a full foam test | "COPQ from late-discovered defects typically 15–20% of revenue for manufacturers without upstream gates" |
| Additive selection | Trial-and-error antifoam or defoamer dosing | Measured elasticity signature guides dose and additive selection | "Reducing trial-and-error is the outcome this page's own positioning statement already states" |
| Candidate ranking | Full trial batches across each candidate surfactant | Equilibrium and dynamic surface tension comparison in a single screening run | "Structured data-driven ranking vs. full-batch trial-and-error" |
| Batch-to-batch consistency | Unmeasured water-quality or supplier-driven variability | Tracked per batch against a surface tension baseline | "Replicate spread detects drift before it reaches a full batch" |
| Audit documentation | Subjective downstream observation; not defensible under audit | Numeric surface tension and adsorption logs with timestamps and lot ID | "Applicable to NCR, CAPA, incoming inspection, and supplier qualification records" |
Instant ROI Snapshot
Foam Control R&D ROI Snapshot
Estimate saved iterations and lab cost.
Result
Monthly savings = materials saved + technician time saved from reduced iterations.
What Surface Tension Measurement Cannot Tell You About Foam
Knowing the limits of any measurement tool is part of using it responsibly.
Use this page to improve formulation screening and upstream troubleshooting, not to replace your standard foam test. The Dropometer is one layer in a quality system, not a substitute for one.
Similar surface readiness workflows
Emulsion Stability Mechanism
A related interfacial screening workflow, relevant since antifoam additives can destabilize emulsions elsewhere in a foam-control formulation.
CMC Assessment Techniques for Surfactant Concentration
The concentration-series measurement this page's surfactant efficiency screening depends on.
Electrolyte Wetting Optimization and Additive Selection
A related R&D screening workflow for additive selection, relevant to the water-quality and electrolyte root cause on this page.
How this page was created
Editorial and technical transparency notes for this page.
Drafting assistance
Initial draft created with AI assistance (Claude 4.8 Opus Pro), then rewritten for technical clarity by Droplet Lab Staff
Transparency Note
Technical review and editing by a surface-science specialist for accuracy
Transparency Note
Identifiers, units, thresholds, and key claims checked against cited sources before publication
Transparency Note
Reviewed every 12 months or when underlying standards or instrument specifications change
Report a correction
Spotted an issue in this summary? Send a correction request and our team will review it.
Correction Request
We work hard to keep this standards summary accurate and up to date. If you spot an error (wrong revision/year, missing requirement, incorrect interpretation, or broken link), tell us and we'll review it.
Contact us to report a correction