Battery R&D & Process Control
Electrolyte Wetting Optimization and Additive Selection for Lithium-Ion Battery Production
Accelerate electrolyte wetting by quantifying contact angle, spreading kinetics, and surface tension on real electrode and separator materials, so you can reduce filling time, catch dry spots, and de-risk additive selection with a QC-ready gate.
Written by
Gurdeep Singh Saini
Holds a BASc in Mechanical Engineering (Ryerson) and an MASc from York University. He focuses on the custom AI behind the instrument.
COO at Droplet Lab
Read More
Technical Review by
Droplet Lab Team
Droplet Lab builds precision instruments and software for surface science measurement, specialising in contact angle analysis and surface tension characterisation. Used by researchers across materials science, pharmaceuticals, coatings, and advanced manufacturing, Droplet Lab's Dropometer has contributed to studies published in peer-reviewed journals including Advanced Functional Materials (Impact Factor 19). The team combines instrument engineering with deep domain knowledge in wettability science with a focus on practical accuracy.
Read More
Reviewed By
Droplet Lab Team
Droplet Lab builds precision instruments and software for surface science measurement, specialising in contact angle analysis and surface tension characterisation. Used by researchers across materials science, pharmaceuticals, coatings, and advanced manufacturing, Droplet Lab's Dropometer has contributed to studies published in peer-reviewed journals including Advanced Functional Materials (Impact Factor 19). The team combines instrument engineering with deep domain knowledge in wettability science with a focus on practical accuracy.
Validated Measurement Approach
Independent benchmarking and publication-based validation references.
Benchmark Validation
Dropometer contact angle and pendant-drop surface tension methods have been benchmarked against KRÜSS DSA100E reference measurements. The instrument is referenced in peer-reviewed journals including Bioactive Materials (Impact Factor 20) and Advanced Functional Materials (Impact Factor 19).
See peer-reviewed validationPublication Evidence
Our instruments are referenced in peer-reviewed journals, theses, and conference publications.
Browse citationsSample Additive Screening: Wetting Performance Comparison
Representative output format. Values are illustrative, not a universal specification.
Actual measurement output
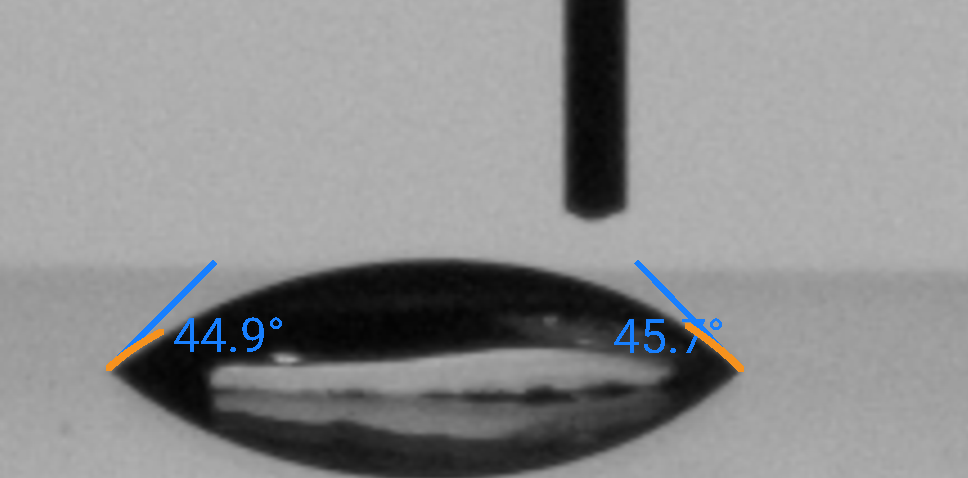
Dropometer contact angle and spreading-kinetics measurement on a real electrode surface, tracking time-to-wet across candidate electrolyte additive formulations. This is the type of output used to select an additive candidate before committing to a full cell build.
Additive A shows a clear wetting improvement over baseline and is a reasonable candidate on wetting data alone. Additive B's surface tension drop is modest and its contact angle and spread-time improvements are marginal, likely not worth the reformulation cost relative to Additive A. Additive C shows the fastest wetting of the three but that result alone doesn't confirm electrochemical compatibility, the wetting screen narrows the candidate list, it doesn't replace impedance and cycle-life testing on whichever additive advances. This output would be included in the additive selection record used to decide which candidate proceeds to a full cell build.
Report a correction
Spotted an issue in this summary? Send a correction request and our team will review it.
Correction Request
We work hard to keep this standards summary accurate and up to date. If you spot an error (wrong revision/year, missing requirement, incorrect interpretation, or broken link), tell us and we'll review it.
Contact us to report a correctionSources
1.
A Systematic Literature Analysis on Electrolyte Filling and Wetting in Lithium-Ion Battery Production. Batteries (MDPI), 9(3), 164 (2023). https://www.mdpi.com/2313-0105/9/3/164
2.
KRÜSS Scientific. Wetting of Battery Electrodes. https://www.kruss-scientific.com/en-US/know-how/use-cases/wetting-of-battery-electrodes
3.
Chen, X. et al. Contact angle measurement with a smartphone. Review of Scientific Instruments, 89, 035117 (2018). https://pubs.aip.org/aip/rsi/article-abstract/89/3/035117/368179/Contact-angle-measurement-with-a-smartphone
4.
Surface tension measurement with a smartphone using a pendant drop. Colloids and Surfaces A: Physicochemical and Engineering Aspects. https://www.sciencedirect.com/science/article/abs/pii/S0927775717307744
5.
Fabrico. The Cost of Poor Quality (COPQ) in Manufacturing: 2026 Guide. https://www.fabrico.io/blog/cost-of-poor-quality-copq-manufacturing-guide/
6.
Making Strategy Happen. The Cost of Quality: The 1-10-100 Rule. https://www.makingstrategyhappen.com/the-cost-of-quality-the-1-10-100-rule/