Contents
R&D Formulation & Durability Testing

Windshield Rain Repellent Performance Verification and Durability Testing for Water-Repellent Coatings

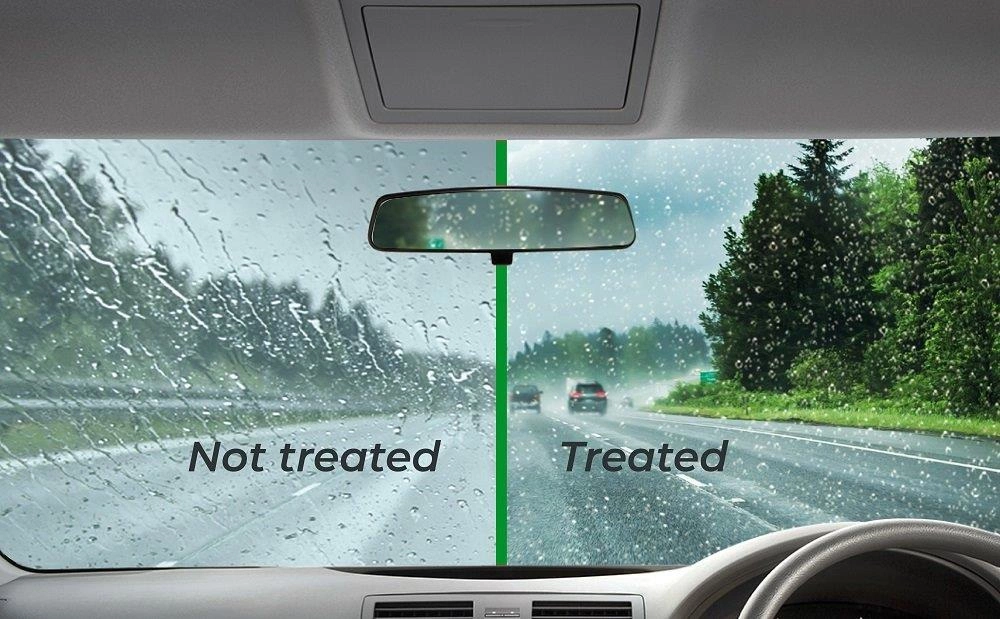
Stop "water stops beading" surprises after the windshield leaves the line. Turn rain repellent performance and durability into traceable numbers instead of a road-test surprise.

Who this is for: Automotive glass, windshield coating, and rain repellent treatment teams; process engineers, R&D formulators, and QA/QC.

Positioning: Dropometer quantifies water contact angle, roll-off angle, and droplet mobility to rank and troubleshoot rain repellent coating formulations. It complements, not replaces, real-world road and rain testing.

Last updated
July 11, 2026
Gurdeep-Saini-Photo
Written by
Gurdeep Singh Saini
Holds a BASc in Mechanical Engineering (Ryerson) and an MASc from York University. He focuses on the custom AI behind the instrument.
COO at Droplet Lab
Read More
Droplet-Lab logo
Technical Review by
Droplet Lab Team
Droplet Lab builds precision instruments and software for surface science measurement, specialising in contact angle analysis and surface tension characterisation. Used by researchers across materials science, pharmaceuticals, coatings, and advanced manufacturing, Droplet Lab's Dropometer has contributed to studies published in peer-reviewed journals including Advanced Functional Materials (Impact Factor 19). The team combines instrument engineering with deep domain knowledge in wettability science with a focus on practical accuracy.

Read More
Gurdeep-Saini-Photo
Written By

Gurdeep Singh Saini

COO at Droplet Lab

Holds a BASc in Mechanical Engineering (Ryerson) and an MASc from York University. He focuses on the custom AI behind the instrument.

Droplet-Lab logo
Reviewed By

Droplet Lab Team

Droplet Lab builds precision instruments and software for surface science measurement, specialising in contact angle analysis and surface tension characterisation. Used by researchers across materials science, pharmaceuticals, coatings, and advanced manufacturing, Droplet Lab's Dropometer has contributed to studies published in peer-reviewed journals including Advanced Functional Materials (Impact Factor 19). The team combines instrument engineering with deep domain knowledge in wettability science with a focus on practical accuracy.


The Cost Of Getting It Wrong

15–20%

of annual revenue consumed by Cost of Poor Quality in typical manufacturing operations

American Society for Quality

10×

higher hidden cost vs. visible scrap cost: rework, re-inspection, downtime, and warranty claims are rarely captured

Lean Six Sigma research consensus

$1 → $10

upstream prevention typically saves $10 in internal rework and up to $100 in external warranty and recall costs, for the specific failure modes an upstream screen actually catches

COPQ prevention-to-failure ratio

ASQ, Learn Lean Sigma, Fabrico COPQ Guide 2026. Figures are industry-wide benchmarks, not Droplet Lab claims. On this page specifically, the highest-cost failure mode is a formulation that ranks well on a single static measurement but underperforms after real-world wiper and washer-fluid exposure; caught in R&D screening, not after the vehicle ships.

QC-Ready Summary

What this workflow does and what it does not

Quick technical reference for engineers and QA managers evaluating fit before reading further.

Evidence Box (QC-Ready)

Problem this solves

Rain repellent coatings that bead water well on day one lose performance after wiper use, washer fluid exposure, or contamination — discovered only after a customer complaint or road test.

Dropometer role in workflow

A quantitative ranking and durability-testing tool for rain repellent coating formulations, used across R&D screening and production batch QC gating. Not a replacement for real-world road or rain testing.

Primary outputs

Static water contact angle at a fixed time after application
Roll-off (sliding) angle across the instrument's tilt range
Advancing/receding hysteresis
Spot-to-spot variability mapping across the windshield
Optional surface energy trend and liquid surface tension QC on the coating formulation itself

Calibration requirement

10–20 representative samples spanning pass and fail durability outcomes
Minimum 2 operators
Locked probe fluid, droplet volume, tilt rate, and capture time, tracked per formulation and cure process

Gate requirement

PASS / MONITOR / FAIL thresholds must be set by correlating wetting and roll-off signals to your real durability and road-test outcomes; formulation- and process-specific, not universal.

Known limitation

Static contact angle alone does not predict real-world repellency. Roll-off and hysteresis metrics plus durability cycling are required, and none of these replace an actual road or rain test.

Who this is for

What are you trying to solve?

The Dropometer serves four roles across a rain repellent coating program. Each has a different primary risk.

Process Engineer

Investigating lot-to-lot inconsistency in coating performance with no clear root cause, especially after a change in application equipment or cleaning protocol.

Unexplained process drift

R&D Formulator

Ranking and gating candidate rain repellent formulations by durability, not just day-one bead appearance, before committing to a production run.

Iteration and lab time cost

QA / QC Manager

Needing a numeric batch release gate before shipping coated windshields to reduce field complaints and warranty claims.

Warranty and complaint cost

Compliance Officer

Requiring documented, defensible evidence of coating performance for NCR responses, CAPA files, or supplier audits.

Audit non-conformance
workflow fit

Is this the right screen for your process?

This is not a universal solution. Check the conditions below before investing further time.

Good fit if

You need to rank or gate candidate rain repellent formulations by durability, not just initial bead appearance
You currently measure static contact angle only and have seen it fail to predict real-world repellency
You need a documented, numeric release gate before shipping, not a purely visual or road-test-only judgment
Your QA or compliance process requires a traceable coating performance record
You need to distinguish contamination, cure, or formulation as the cause of a performance drift, rather than guessing

Less relevant if

You need a direct simulation of real rain and road conditions with no proxy substitute; this is a lab and line screen, not a replacement for road testing
You have no formulation or batch-to-batch comparison need and are not troubleshooting a performance complaint
Your acceptance test is purely a field road test with no appetite to add an upstream lab or line gate
Performance issues are confirmed to trace back to the glass substrate itself (defects, structural issues) rather than the coating; see Honest Scope for why this instrument doesn't screen for that directly
Root Cause Context

Why "It Beaded Water on Day One" Isn't the Same as "It Works"

Rain repellent coatings degrade with use. The metric most teams measure first, static contact angle, is the one least able to predict that degradation.

Water-repellent windshield coatings work by achieving a high contact angle, generally cited above 100 degrees for automotive glass coatings, so droplets bead and roll away rather than sheeting across the glass. Modern rain repellent products degrade over time from wiper abrasion, washer fluid exposure, and general contamination — a pattern documented in the water-repellent glass literature, which specifically identifies wiper-simulated abrasion as a driver of coating wear.

The most common diagnostic mistake is relying on static contact angle alone. A surface can be highly hydrophobic by that single number and still perform poorly in practice, because a high contact angle doesn't guarantee the droplet actually rolls off — a coating can be repellent and still "sticky." Roll-off angle and hysteresis are the metrics that actually predict whether water and contaminants evacuate the surface, which is the real-world behavior a windshield needs.

This workflow adds day-one verification (does the fresh coating meet its target contact angle and roll-off angle) and durability validation (does it still meet that target after simulated wiper cycles, washer fluid exposure, and contamination). The goal is not to replace a road test. The goal is to catch a formulation or process problem in the lab or at the line, before it reaches a customer's windshield in the rain.

Recognition

What Does Rain Repellent Performance Drift Actually Look Like?

Many teams ship a coating that looked good on day one, only to find performance has degraded by the time it matters, in the rain, months after installation.

Water beading disappears after relatively short wiper use.
Reduced visibility during rain, reported after the coating has already degraded.
Lot-to-lot inconsistency in how long the effect lasts.
Frequent reapplication needed sooner than the formulation's target durability.
Customer complaints about increased wiper usage or reduced rain visibility.
Disagreement between a passing lab measurement and a failing field or road-test result.
Diagnosis

Root Causes

Why:

  • Oils, silicone, or cleaner residue on the glass before application prevent uniform coating adhesion.

How to detect:

  • High variability in contact angle across the windshield

Corrective action:

  • Standardize the pre-application cleaning protocol Verify cleanliness before coating, not just after

Why:

  • Uneven spray or wipe application creates mixed repelling behavior across the same windshield.

How to detect:

  • Zone differences between centre and edges

Corrective action:

  • Optimize spray pattern or application method Verify coverage across multiple zones, not a single spot

Why:

  • Improper cure time, temperature, or humidity reduces durability even when the initial application looked correct.

How to detect:

  • Good initial bead performance but poor durability after cycling

Corrective action:

  • Control and validate cure time, temperature, and humidity against the formulation's specification

Why:

  • Mechanical abrasion from wiper use and surfactants in washer fluid reduce hydrophobic performance over the service life of the coating.

How to detect:

  • Increased roll-off angle and reduced droplet motion after simulated wiper or washer-fluid cycling

Corrective action:

  • Improve formulation durability against abrasion and surfactant exposure Set a re-application or maintenance interval based on measured degradation rate

Why:

  • Static contact angle alone can look acceptable while real-world droplet mobility is poor, because a high angle doesn't guarantee the droplet actually rolls off.

How to detect:

  • High static angle but poor water droplet movement in practice

Corrective action:

  • Add roll-off angle and hysteresis to the QC protocol rather than relying on static angle alone

Why:

  • If wetting and roll-off signals are within range but field complaints continue, the issue may be in the glass substrate itself, or a real-world condition (heavy soiling, extreme temperature) this lab protocol doesn't simulate.

How to detect:

  • Lab measurements pass consistently while field or road-test results still fail

Corrective action:

  • Escalate to a broader road-test or field-condition review, and inspect the glass substrate itself for defects unrelated to the coating

Not sure which root cause applies to your process?

A surface science specialist can review your failure history and help you identify whether a surface screen would add a useful upstream gate.

For Compliance Officers and QA Managers

Building a defensible coating performance record

Surface readiness measurement produces the type of numeric, traceable output that a subjective visual bead check cannot. If your quality system requires documented evidence of process control for NCR responses, CAPA files, or supplier audits, contact angle and roll-off measurement provide that evidence in a format your QA documentation already requires.

Audit trail

Numeric contact angle, roll-off angle, and variability values with replicate spread, timestamps, operator records, and formulation/lot identification; replacing subjective "water beads nicely" notes with defensible numeric logs.

CAPA evidence

When a field complaint triggers a Corrective and Preventive Action file, contact-angle and roll-off data before and after durability cycling provide quantitative evidence of coating condition, not anecdotal descriptions.

NCR documentation

Non-conformance reports that include numeric roll-off and contact-angle data allow you to assign root cause to contamination, application, cure, or formulation with evidence, not inference.

Supplier qualification

Incoming coating formulation or coated-glass inspection using contact angle and roll-off measurement provides a numeric acceptance criterion for supplier lot approval.

Process control records

Contact-angle and roll-off trend logs demonstrate statistical process control at the coating step; relevant to Six Sigma, SPC, and DMAIC programs targeting warranty-driven COPQ.

Formulation ranking record

Durability-cycled roll-off and hysteresis data across candidate formulations gives R&D a numeric basis for gating which formulation advances, instead of a subjective day-one bead comparison.

What to Measure

Baseline

Water Contact Angle

Why it matters: The baseline water-repellent indicator; automotive water-repellent glass coatings are generally cited as needing contact angles above 100 degrees to reliably bead and shed water.

How to interpret: Track the trend over time and after durability cycling, not just the day-one value.

When it is not enough: Does not by itself capture how easily a droplet actually rolls off.

Primary screen

Roll-off (sliding) angle

Why it matters: A direct measure of whether water and contaminants actually evacuate the surface, the real-world behavior a windshield needs.

How to interpret: Lower roll-off angle is better; failure to roll off even at the top of the instrument's tilt range indicates poor real-world performance.

When it is not enough: Sensitive to surface roughness independent of coating chemistry.

Primary screen

Hysteresis (advancing minus receding angle)

Why it matters: Indicates droplet pinning; a surface can be nominally hydrophobic and still trap droplets.

How to interpret: Lower hysteresis generally means better repellency in practice.

When it is not enough: Still a lab proxy, not a full real-world rain simulation.

Diagnostic

Variability Mapping

Why it matters: Identifies weak zones across the windshield rather than relying on a single spot check.

How to interpret: High spread indicates inconsistent coating coverage.

When it is not enough: Doesn't identify the specific cause of the inconsistency.

Diagnostic

Surface Energy

Why it matters: Helps distinguish a coating-driven wetting change from a contamination-driven one.

How to interpret: Use as a comparative trend between formulations or lots, not an absolute cross-lab number.

When it is not enough: Diagnostic only, not a pass/fail metric on its own.

Formulation QC

Liquid Surface Tension of the coating formulation

Why it matters: Confirms formulation consistency batch to batch, independent of how it performs once applied.

How to interpret: A deviation from the expected value indicates a formulation or mixing issue upstream of application.

When it is not enough: QC for the liquid formulation, not a measurement of applied-coating performance.

Validated Measurement Approach

Independent benchmarking and publication-based validation references.

Benchmark Validation

Dropometer contact angle and pendant-drop surface tension methods have been benchmarked against KRÜSS DSA100E reference measurements. The instrument is referenced in peer-reviewed journals including Bioactive Materials (Impact Factor 20) and Advanced Functional Materials (Impact Factor 19).

See peer-reviewed validation

Publication Evidence

Our instruments are referenced in peer-reviewed journals, theses, and conference publications.

Browse citations
QC Protocol

How Dropometer Fits Your Workflow

Dropometer is best used to rank candidate formulations in R&D and as a batch release gate in production, with durability cycling built into both.

1

Define "best" and build a baseline

Align the target metric with real outcomes (visibility, wet-weather performance, durability): Measure known-good samples to set the baseline Lock probe fluid, droplet volume, tilt rate, and capture time

2

Add a QC gate and screen every batch

Run contact angle and roll-off testing on fresh coating: PASS: within baseline band → release for shipment MONITOR: borderline result → repeat measurement, check application and cure records FAIL: out of band → hold, troubleshoot before release

3

Run durability cycles

Simulate the conditions that degrade rain repellent coatings: Wiper abrasion cycling Washer fluid exposure General soiling/contamination exposure Re-measure contact angle and roll-off angle after each

4

Troubleshoot and document

Use the signal pattern to isolate the cause: Contamination, application, cure, or formulation, per the Root Causes section Document decision and measurement values in the QC log

We completed our gage R&R study on the unit and it performed very well.

Brandon Barbee

Corporate Quality Engineer - Zeus Industries - Polymer Manufacturing

Download the Rain Repellent QC Protocol Template

An editable protocol template your team can adapt for your formulation, application method, and durability targets. Includes measurement protocol, gate-setting guidance, and a QC log format ready for your documentation system.

Example Outputs

Sample Rain Repellent Durability Log: Day-One vs. After Simulated Wear

Representative output format. Values are illustrative, not a universal specification.

Actual measurement output

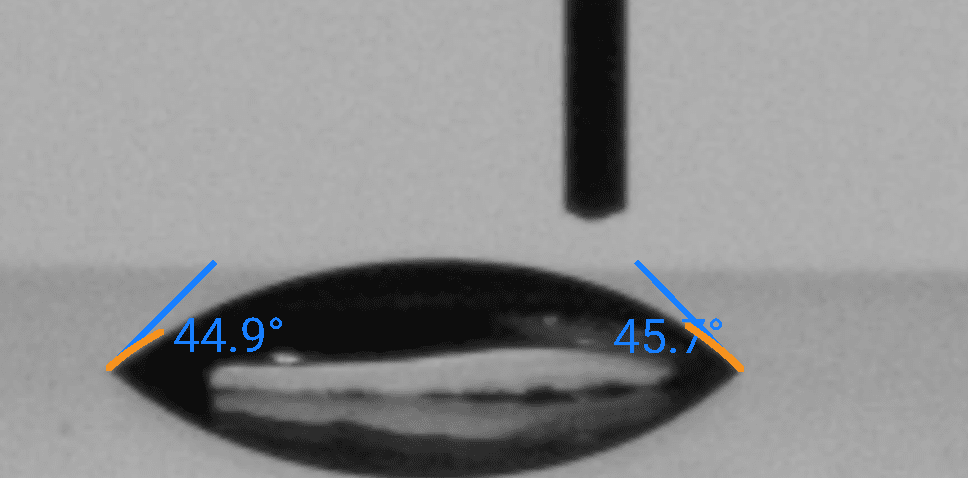
Dropometer contact angle and roll-off measurement; DI water on glass, the most directly representative of the four available reference images for this page's actual substrate. Left contact angle and right contact angle shown with fitted tangent lines, plus roll-off behavior on the tilt stage. This is the type of output used to make a batch release or formulation-ranking decision.

Sessile drop contact angle measurement: DI Water on Glass, left contact angle 44.9°, right 45.7°

Sample Rain Repellent Durability Log: Day-One vs. After Simulated Wear

Condition Contact Angle (°) Roll-Off Angle (°) vs. Baseline
Day one — centre 108° Within range
Day one — edge 104° 11° Within range
After 500 wiper cycles — centre 96° 24° Degraded, monitor
After 500 wiper cycles + washer fluid — centre 81° No roll-off at 60° tilt Failure
Post re-coat — centre 106° Recovered

Day-one readings meet target on both metrics. After 500 wiper cycles, contact angle is still nominally in the hydrophobic range (above 90 degrees) but roll-off angle has more than doubled; the coating is degrading in exactly the way static contact angle alone would miss. After washer-fluid exposure is added, the droplet no longer rolls off even at the instrument's maximum 60 degree tilt, a clear failure. Re-coating restores day-one performance. This output would be included in the durability record used to set a re-application interval or to gate this formulation in R&D.

Troubleshooting

Rain repellent performance troubleshooting guide

Start condition: rain repellent complaints, reapplication requests, or lot-to-lot inconsistency are increasing. Use the signal pattern to identify the most likely cause.

Signal A

High variability in contact angle across the windshield

Likely cause: Surface contamination or non-uniform coating application.
Action: Test multiple zones (centre, edges). If contamination is suspected, review the pre-application cleaning protocol; if it's an application pattern, review spray coverage.

Signal B

Good initial bead but poor durability after cycling

Likely cause: Cure window variability: the coating wasn't fully cured even though it looked correct on application.
Action: Audit cure time, temperature, and humidity against the formulation's specification.

Signal C

Increased roll-off angle and reduced droplet motion after wiper or washer-fluid cycling

Likely cause: Formulation durability limit reached: abrasion or surfactant exposure has degraded the coating.
Action: Improve formulation durability or set a shorter re-application interval based on the measured degradation rate.

Signal D

High static contact angle but poor real-world droplet movement

Likely cause: Wrong metric selected: static angle alone doesn't capture roll-off behavior.
Action: Add roll-off angle and hysteresis to the standard QC protocol instead of relying on static angle alone.

FAQ

Common questions before adoption

No. A surface can measure as highly hydrophobic by static angle and still perform poorly in practice, because a high angle doesn't guarantee the droplet actually rolls off. Roll-off angle and hysteresis are the metrics that predict real-world droplet mobility.

There is no universal threshold. You establish your own PASS / MONITOR / FAIL gates by correlating measured roll-off angle to your own road-test and durability outcomes for your specific formulation.

No. It's a lab and line screen that complements road testing by catching formulation and process problems earlier and more cheaply than a full road-test cycle can.

By running simulated wiper abrasion cycles, washer fluid exposure, and general soiling exposure, then re-measuring contact angle and roll-off angle after each — not by relying on a single day-one reading.

Partially. The signal pattern (which metric moved, and after which exposure) narrows the cause to contamination, application, cure, or formulation durability, per the Root Causes and Troubleshooting sections. It doesn't chemically identify the degradation mechanism on its own.

Yes. Running the same durability protocol across candidates and comparing roll-off and hysteresis after cycling gives R&D a numeric basis for gating which formulation advances.

Yes. The Dropometer produces numeric contact-angle, roll-off, and variability logs with replicate data, timestamps, and operator records, usable in NCR responses, CAPA files, and supplier audit packages.

Business Impact

What Changes When You Screen for Durability, Not Just Day-One Bead

Before and with Dropometer; operational outcomes

Metric Before Dropometer With Dropometer Indicative Benchmark
Failure discovery point After a customer complaint or road test, months after shipment Lab and line screen with durability cycling before release "COPQ from late-discovered defects typically 15–20% of revenue for manufacturers without upstream gates"
Formulation ranking Subjective day-one bead comparison Numeric roll-off and hysteresis data after simulated wear "Wrong-metric selection is a named, documented root cause, not a hypothetical one"
Troubleshooting cycle Multi-day, opinion-driven; no numeric baseline to compare against Same-shift, data-driven; signal pattern isolates contamination, application, cure, or formulation as cause "Structured data-driven diagnosis vs. iterative trial-and-error"
Batch consistency Unmeasured zone-to-zone variation across the windshield Tracked per zone, per batch "Variability mapping identifies weak zones before shipment"
Audit documentation Subjective notes ("water beads nicely"); not defensible under audit Numeric contact-angle and roll-off logs with timestamps and lot ID "Applicable to NCR, CAPA, incoming inspection, and supplier qualification records"

Instant ROI Snapshot

Rain-Repellent R&D ROI Snapshot

Estimate saved iterations and lab cost.

Each Dropometer unit is $5,000 — default models 1 unit.
Coating and glass material cost per test batch.
Application, contact-angle/roll-off measurement, and analysis.
Conservative range: 25-45%.

Result

~0
Iterations saved / month
~0
Monthly savings
~0
Payback period
~0
Year-1 net benefit

Monthly savings = materials saved + technician time saved from reduced iterations.

Honest scope

What Contact Angle and Roll-Off Measurement Cannot Tell You

Knowing the limits of any measurement tool is part of using it responsibly.

Don't rely on static contact angle alone; it is the metric most likely to mislead you about real-world repellency on this specific application.
No universal roll-off angle threshold exists for rain repellent performance; PASS/MONITOR/FAIL gates must be built per formulation, correlated to your road-test outcomes.
Don't change test parameters (droplet volume, tilt rate, capture time) mid-program; durability trends are only comparable against a consistent protocol.
Curved windshield samples require proper fixturing; inconsistent fixturing introduces variability unrelated to coating performance.
Durability cycling in the lab is a proxy for wiper, washer-fluid, and soiling exposure; it does not simulate every real-world condition (extreme temperature, heavy road salt, etc.).
Use wetting and roll-off metrics as an upstream quality gate, then confirm final suitability with your established road-test and field-durability program.

Use this page to improve formulation ranking and upstream troubleshooting, not to replace real-world testing. The Dropometer is one layer in a quality system, not a substitute for one.

How this page was created

Editorial and technical transparency notes for this page.

Transparency Details 4 checklist items
01

Drafting assistance

Initial draft created with AI assistance (ChatGPT 5.2 Pro), then rewritten for technical clarity.

02

Technical review

Reviewed and edited for technical accuracy by a surface-science specialist.

03

Verification steps

Identifiers, units, thresholds, and key claims checked against cited sources before publication.

04

Updates

Reviewed every 12 months or when the underlying standard changes.

Report a correction

Spotted an issue in this summary? Send a correction request and our team will review it.

Correction Request

We work hard to keep this standards summary accurate and up to date. If you spot an error (wrong revision/year, missing requirement, incorrect interpretation, or broken link), tell us and we'll review it.

Contact us to report a correction
References

Sources

1.
Water-repellent glass. Wikipedia. Overview of windshield water-repellent coating mechanisms and wiper-abrasion-driven durability degradation. https://en.wikipedia.org/wiki/Water-repellent_glass
2.
DuraSlic. Roll-Off and Sliding Angle: Hydrophobic Surface Science — What's That All About? https://www.duraslic.com/roll-off-and-sliding-angle-whats-that-all-about/
3.
Chen, X. et al. Contact angle measurement with a smartphone. Review of Scientific Instruments, 89, 035117 (2018). https://pubs.aip.org/aip/rsi/article-abstract/89/3/035117/368179/Contact-angle-measurement-with-a-smartphone
4.
Fabrico. The Cost of Poor Quality (COPQ) in Manufacturing: 2026 Guide. https://www.fabrico.io/blog/cost-of-poor-quality-copq-manufacturing-guide/
5.
Making Strategy Happen. The Cost of Quality: The 1-10-100 Rule. https://www.makingstrategyhappen.com/the-cost-of-quality-the-1-10-100-rule/