Primary surface measurement reported
Oil–water interfacial surface tension for octane-in-water droplets, reported as 𝑔𝑜𝑤≈10mJ m−2.

Client Citation Analysis
Oil–water interfacial surface tension for octane-in-water droplets, reported as 𝑔𝑜𝑤≈10mJ m−2.
"The droplets try to remain round due to surface tension (γow ≈ 10 mJ/m2, as measured by the 'Dropometer' from Droplet Labs)." — Section 3, Experimental methods. This is the paper's only mention of the instrument. It gives no model number and no software version, and it spells the company "Droplet Labs".
The reported interfacial tension sets the capillary scale used to describe droplet shape restoration, and is carried into a quasi-2D framework where an effective 2D surface tension γ = γ_exp·H is defined from the experimental 3D value and used to form the dimensionless group Γ_exp for experiment–simulation comparison. The simulations' control parameter is a separate dimensionless line tension Γ, obtained by fitting the simulated droplet speed to the experiments and swept over more than three decades — a range the authors could not reach experimentally. The measured value was never varied: it is a single scalar for a single fluid pair.
No replication is reported for the surface-tension measurement — it is a single value, given to one significant figure with no uncertainty. The paper's replication statement belongs to a different quantity: "The error bars for the experimental data are obtained using the standard deviation of the measured quantities from at least five different trials with one droplet" (Fig. 2, 3 and 4 captions) — five repeats on one droplet, applied to the droplet speed and shape data acquired on the microscope, not to the interfacial tension.
It supplied one number: the octane–water interfacial tension, γ_ow ≈ 10 mJ/m², quoted once in the Experimental methods section. It was not the primary measurement instrument; the droplet shape and speed data were acquired on a Leica DM4500 B inverted microscope with a ThorLabs DCC1545M camera, the driving force was set with a Wixley digital angle gauge, and every quantitative result on clogging and flow rate came from deformable-particle and soft-particle simulations run on Yale's Center for Research Computing. The interfacial tension appears in 0 of the paper's 15 figures; it enters only through Eq. 12, as one of five terms in the dimensionless group Γ_exp.
Oil–water interfacial tension, reported as γ_ow ≈ 10 mJ/m² and attributed to the "Dropometer" from Droplet Labs. The oil phase is octane (ρ_o = 0.703 g/mL) and the continuous phase is water (ρ_w = 0.997 g/mL) containing 0.5% Tween 20 nonionic detergent, which the authors state was "still necessary… to prevent sticking of the oil droplets to the microscope slide surfaces." The paper does not state whether the detergent was present during the tensiometry.
In the quasi-2D experiments, droplet speed in the driving direction and droplet shape evolution were extracted from microscope videos as droplets moved through a narrow orifice. In the simulation studies, quantities tied to droplet flow and arrest in obstacle arrays (e.g., clogging statistics and mean flow speeds) were evaluated as functions of geometry and a surface-tension-related model parameter.
‘‘Dropometer’’ from Droplet Labs
Leica DM4500 B inverted microscope (with 1.6× lens, 0.05 numerical aperture) + ThorLabs DCC1545M camera (with 0.35× C-mount)
Wixley digital angle gauge
hand-held syringe
Laser-cut plastic film, 400 µm thick, between two glass microscope slides, bonded with Norland Optical Adhesive; obstacles formed by curing drops of UV adhesive into cylinders spanning the chamber
Deformable-particle (DP) and soft-particle (SP) simulations, run on the High Performance Computing facilities of Yale's Center for Research Computing
The paper reports the oil–water interfacial surface tension as 𝑔𝑜𝑤≈10mJ m−2, “as measured by the ‘‘Dropometer’’ from Droplet Labs,” and uses this value as the surface-tension scale governing droplet capillarity (the tendency for droplets to remain round) during confined, gravity-driven motion. The experimental interfacial tension is then carried into the quasi-2D analysis used to define a dimensionless surface-tension quantity for comparing experimental droplet deformation and speed profiles to the deformable-particle (DP) simulations.
In the study's workflow the Dropometer value is a benchmark, not a simulation input. The DP simulations are not run at the measured surface tension: the line tension Γ* is obtained by fitting the simulated droplet speed to the experiments, and the authors report that "we obtain values for the dimensionless line tension Γ* that are a factor of ∼3 smaller than the dimensionless surface tension Γexp in experiments" — Γ* ≈ 0.16 against Γ_exp ≈ 0.57, 1.7 against 5.80, 1.08 against 3.47. The measured γ also cancels out of the relation the authors use to carry the calibration between experiments, Γ**/Γ* = (σ*)²sinθ*/((σ**)²sinθ**), which contains only tilt angle and droplet diameter. What the measurement buys the paper is an absolute axis: it lets the authors place their experiments on a dimensionless surface-tension scale and state how far their 2D fit sits from the 3D physical value.
None of Measurement conditions & uncertainty are reported. The paper gives the interfacial tension to one significant figure with an approximation sign — "γow ≈ 10 mJ/m2" — and states nothing further: no Dropometer model number, no software version, no pendant-drop or sessile-drop mode, no drop volume, no temperature, no replicate count, and no uncertainty. The paper also does not state whether the 0.5% Tween 20 used in the flow experiments was present in the aqueous phase during the tensiometry; the standard literature value for a clean octane/water interface is ≈50 mN/m, so the reported value is consistent with a surfactant-laden interface rather than a clean one.
The oil–water interfacial surface tension is reported as
𝑔𝑜𝑤 ≈ 10 mJ m−2, “as measured by the ‘‘Dropometer’’ from Droplet Labs,” and is used to describe why droplets tend to remain round and resist deformation in confinement.
The authors define an effective 2D surface tension γ = γ_exp·H from the experimental 3D interfacial tension in the quasi-2D limit, and use it to define the dimensionless group Γ_exp = γ_exp / (g_exp ρ_o σ²), with g_exp = sinθ·g(ρ_w − ρ_o)/ρ_o. Γ_exp is a calculated quantity, not a measured one: because the single measured γ was held fixed, the spread in reported values — Γ_exp ≈ 0.57, 0.88, 3.47 and 5.80 — is produced entirely by changing the microscope tilt angle θ and the droplet diameter σ.
The DP simulations are calibrated against experiments of a single droplet flowing through narrow channels by tuning a dimensionless line tension 𝐺 and a near-wall drag coefficient ratio 𝑏0/𝑏𝑁 to minimize deviations in droplet speed (and comparing shape in parallel). For one calibration case (w = 0.4σ, σ ≈ 3.5 mm, θ ≈ 28°), the paper reports Γ* = 0.16 ± 0.01 and b*₀/b_∞ = 0.064 ± 0.003, giving deviations of Δ_v ≈ 0.09 in speed and Δ_A ≈ 0.01 in shape parameter. Overall the authors state the simulations "recapitulate the experimental results for the droplet shape and speed for flows within narrow channels with an error of less than 10%."
The paper reports a nonmonotonic droplet speed profile as the droplet exits the narrow orifice, including cases where the droplet speed exceeds the terminal speed far from the constriction, with overshoot behavior discussed in terms of the balance between capillarity and driving.
In deformable-particle simulations — not in experiments — the clogging probability becomes nonmonotonic with the dimensionless line tension Γ: at large Γ droplets are nearly rigid and clogging is high; clogging decreases as Γ decreases and droplets become more deformable; and clogging increases again at small Γ, where highly deformable droplets wrap around obstacles. The result is expressed as a clogging decay length λ from a Poisson model P(r) = e^(−r/λ), measured over Γ ≈ 0.04–10 and gap ratios w_ob/σ = 0.2–0.5. The corresponding experiments were qualitative only (see the finding above).
The authors state that varying surface tension in the experiments by more than a factor of 2 is challenging, and they therefore carry out simulations with surface tensions varying by more than a factor of
10^3 to accentuate wrapping behavior.
The paper draws an explicit line between its two experimental programmes: "Note that quantitative experimental studies were performed on flows of capillary droplets through narrow orifices. In contrast, only qualitative experimental studies of droplets flowing through obstacle arrays were performed to illustrate the droplet squeezing and wrapping mechanisms. The experimental studies of droplets in obstacle arrays were only featured in the images in Fig. 5 (a) and (c)." Every quantitative statement about clogging probability, decay length and average droplet speed in obstacle arrays comes from simulation.
The value that best fits the experiments is not the value the Dropometer measured. Across every tilt angle and droplet diameter studied, the authors find "Γ**/Γexp ≈ 0.3" — Γ* ≈ 0.16 against Γ_exp ≈ 0.57, Γ** ≈ 1.7 against 5.80, Γ** ≈ 1.08 against 3.47. Their explanation: the discrepancy "likely stems from the fact that we compare values of the dimensionless line tension in 2D to values of the dimensionless surface tension in 3D." The authors nonetheless describe Γ* as "comparable to Γexp," and name a fully three-dimensional DP model with true surface tension as their first item of future work.
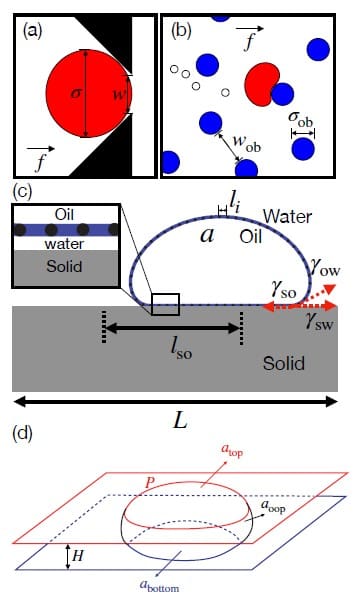
Figure 1(d) shows the geometric decomposition of surface area — top-facing, bottom-facing and out-of-plane — used to motivate the quasi-2D treatment γ = γ_exp·H that connects the experimental interfacial tension to the 2D modelling framework. Panels (a)–(c) of the same figure are schematics of the narrow-orifice geometry, the obstacle array, and the solid–oil–water line tensions in the DP model.
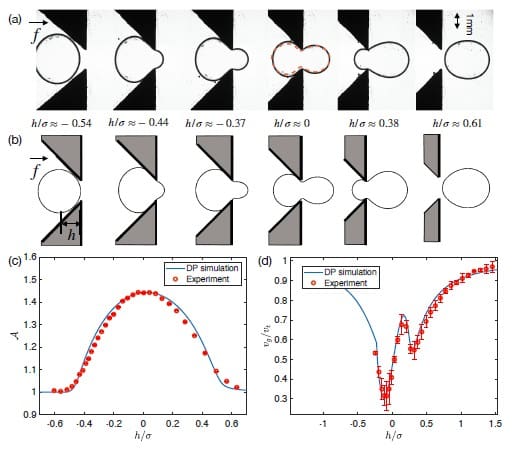
Presents experimental and DP-simulation droplet shapes and speeds through a narrow orifice at w = 0.4σ, and reports the fitted parameters Γ* ≈ 0.16 and b*₀/b_∞ ≈ 0.064 alongside a calculated Γ_exp ≈ 0.57 for the experimental condition (σ ≈ 3.5 mm, θ ≈ 28°). Note that this figure was replaced by a published correction — Soft Matter 2024, 20, 8158, DOI 10.1039/D4SM90160F — and the corrected version is the one described here. The images are microscope frames; the Droplet Labs measurement contributes to the caption's Γ_exp only, through Eq. 12.
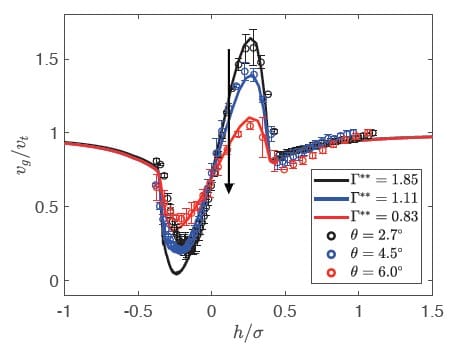
Plots v_g/v_t versus position relative to the orifice at w = 0.7σ for three tilt angles — 2.7°, 4.5° and 6.0° — showing the speed overshoot and reporting the fitted line tensions Γ** = 1.85, 1.11 and 0.83 for the calibrated DP simulations. Experimental error bars are standard deviations from at least five trials with one droplet.
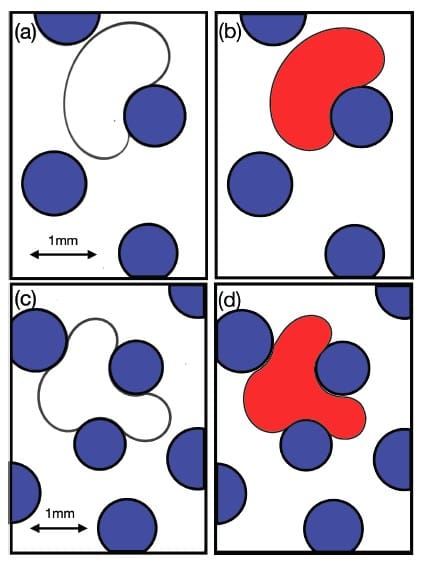
Shows experimental images (panels a and c) and calibrated DP simulations (panels b and d) illustrating wrapping and squeezing, with the caption reporting a calculated Γ_exp ≈ 0.88 for the experimental condition (θ ≈ 90°, σ ≈ 2 mm, σ_ob/σ ≈ 0.3–0.4, w_ob/σ ≈ 0.2) against Γ ≈ 0.3 in the matched simulation. Panels (a) and (c) are the paper's only experimental obstacle-array data, and the authors describe them as qualitative illustrations of the two mechanisms.
This paper frames surface tension as the capillary property that governs droplet deformability in confined geometries, shaping how droplets slow down, deform, and either pass through or arrest in constrictions and obstacle arrays. The Dropometer-measured oil–water interfacial tension establishes the experimental capillarity baseline against which the simulations are judged. Its contribution is narrow and worth stating precisely: one scalar, γ_ow ≈ 10 mJ/m², appearing in none of the paper's fifteen figures and entering the analysis only through Eq. 12. It does not set the simulations' surface tension — that parameter is fitted, and lands about three times lower. What it does provide is an absolute scale, without which the authors could not have reported how far a 2D line-tension model sits from the 3D physical value. This is an independent, NSF-funded study by groups at Yale, Emory and CCNY with no Droplet Lab involvement of any kind.
By connecting capillarity-controlled deformation to two distinct obstacle-array clogging mechanisms (squeezing versus wrapping) and showing nonmonotonic clogging trends with line tension in simulation, the study supports a more predictive understanding of droplet transport through complex microfluidic-like geometries. The authors propose applying it to deterministic lateral displacement devices, to separate droplets or cells "at fixed size but varying surface tension."
The study uses γ_ow ≈ 10 mJ/m² (measured by the "Dropometer") as the interfacial-tension value that underpins the capillarity arguments and the quasi-2D surface-tension scaling. Note that a single scalar was enough for this purpose: the paper reports it to one significant figure, with no uncertainty, and never varies it.
The paper defines a dimensionless experimental surface-tension quantity Γ_exp from the measured interfacial tension, the tilt angle, the droplet diameter and both fluid densities, and uses it when comparing measured droplet shape and speed to DP simulations.
The reported speed profile through a narrow orifice is nonmonotonic and can exceed the terminal speed after the droplet exits the constriction, with the behaviour discussed in terms of capillary versus driving effects. The overshoot grows as the driving is reduced: the amplitude increases with decreasing tilt angle, because the excess surface energy stored during deformation is set by the orifice width while the kinetic energy at terminal speed falls with the driving force.
Wrapping is shown qualitatively in experiment (Fig. 5a) and quantified in DP simulation: very deformable droplets wrap around obstacles, which decreases average speed in the continuous-flow regime and raises clogging probability in the permanent-clog regime. Both quantitative effects are simulation results. The soft-particle model, which allows droplet–obstacle overlap instead of explicit shape change, cannot reproduce wrapping at all — which is the paper's argument for modelling shape explicitly.
For obstacle arrays, the paper states that permanent clogs can form when w_ob/σ < 1, and that single droplets flow continuously without clogging for w_ob/σ ≫ 1. Continuous-flow results are reported for gap ratios w_ob/σ = 1.0–1.3, and the clogging study for w_ob/σ = 0.2–0.5.