Contents

At-a-Glance Summary

How the paper credits the instrument

Verbatim, Section 3 (Results): "In our experiment, we measure the TPM surface tension using the pendant drop method (Dropometer, made by Dropletlab). We measure the surface tension to be Σ = 3 mN/m, which is consistent with previous work."

How the surface-tension data were used in the study

Σ is used in two places. First, the authors assume a deformation energy ε = Σd² — "which should be the correct order of magnitude" — and compare it against thermal energy to get an effective temperature Teff = kBT/ε. Second, Σ nondimensionalises the yield-stress axis in Fig. 5(b), as σ₀ = σ_y d / Σ. Everything else in the paper — flow curves, yield stress, Herschel–Bulkley and Three Component fits, droplet sizing, volume fraction — came from the rheometer, the SEM and a weighing method.

What the instrument did, and what it did not do

The Dropometer measured one quantity: the oil–water surface tension of the TPM/water system, Σ = 3 mN/m, by pendant drop. It was not the primary measurement instrument — every data figure in the paper came from an Anton Paar MC302 rheometer, and droplet sizing came from a Topcon DS-150F field-emission SEM. The paper has five figures and the Dropometer produced none of them. What that single value does is convert a droplet diameter into a deformation energy, which is the comparison the paper's entire glass-versus-jamming argument rests on, and it is what lets the authors put their data on the same axes as two prior studies that used oils with different surface tensions.

Paper Details

Title
Rheology finds distinct glass and jamming transitions in emulsions
Authors
Cong Cao; Jianshan Liao; Victor Breedveld; Eric R. Weeks
Journal
Soft Matter
Year
2021
Pages / Article
17, 2646–2654
DOI
10.1039/D0SM02097D
Funding & interests
Funded by the US National Science Foundation under Grant No. DMR-1609763 (C.C. and E.R.W.). Authors are at Emory University (Department of Physics) and Georgia Tech (School of Chemical & Biomolecular Engineering). The paper states: "There are no conflicts to declare." Droplet Lab appears in no funding statement, acknowledgement or affiliation — the instrument was purchased and used as a lab tool, and the product credit is a routine methods attribution.
Related source
This work also appears as Chapter 4 of Cong Cao's PhD dissertation, "Glassy and Jammed Systems: Structures and Dynamics," Emory University, 2020.
5.4
Scopus metrics (Elsevier / Scopus rating 2024)
CiteScore 2024
Scopus metrics (Elsevier / Scopus rating 2024)
CiteScore subject ranks (CiteScore 2024)
  • Q2 - Physics and Astronomy - Condensed Matter Physics (122/443)
  • Q2 - Chemistry - Chemistry (all) (133/404)
0.779
Scopus metrics (Elsevier / Scopus rating 2024)
SNIP 2024
0.684
Scopus metrics (Elsevier / Scopus rating 2024)
SJR 2024
2.8
Journal Impact Factor (Clarivate JCR)
Journal Impact Factor (JCR 2024)
Journal Impact Factor (Clarivate JCR)
5-Year Impact Factor
JCR category rank

What Was Measured

Primary surface / interfacial measurement

The TPM oil–water surface tension, measured by pendant drop and reported as Σ = 3 mN/m. It is a single value: the paper gives no replicate count, no error bar, no drop volume, no needle geometry and no measurement temperature for it, and validates it by agreement with previous work (ref. 35) rather than by internal repeats. It is referenced as the oil–water surface tension in the paper's yield-stress normalisation (Fig. 5b) and in the assumed deformation energy ε = Σd².

Supporting measurements

The study measures steady-shear rheology (shear stress versus strain rate, γ̇ from 10² to 10⁻³ s⁻¹) across volume fraction φ and uses model fits (Herschel–Bulkley and a Three Component model) to describe yield-stress behavior. Droplet sizes are determined from SEM imaging of AIBN-polymerized droplets, with differential dynamic microscopy as a cross-check agreeing to within 5%; the authors note polymerisation shrinks the droplets, so "it is likely that the emulsion droplets are 2% larger than the numbers we report." Volume fractions are determined gravimetrically by weighing before and after water evaporation, then corrected for a 17.5 nm interdroplet water film taken from prior literature — the authors state "we do not have an independent measurement of h." Volume fractions are correct relative to one another to ±0.003 but carry an additional ±0.02 systematic uncertainty.

Instruments Mentioned

Surface tension

Pendant drop tensiometer — "(Dropometer, made by Dropletlab)" — single value, Σ = 3 mN/m; produced no figure of its own

Rheology

Anton Paar MC302 rheometer

Droplet size (SEM)

Topcon DS-150F Field Emission SEM

Droplet size cross-check

Differential dynamic microscopy (DDM); no instrument model stated

Volume fraction

Gravimetric — samples weighed before and after water evaporation; no balance model stated

Role of the Dropometer

The Dropometer measured the surface tension of the TPM oil–water system by the pendant drop method. The paper states, in Section 3: "In our experiment, we measure the TPM surface tension using the pendant drop method (Dropometer, made by Dropletlab). We measure the surface tension to be Σ = 3 mN/m, which is consistent with previous work." That is one value. The paper reports no replicate count and no error bar for it, and the only check on it is agreement with the previous measurement it cites (ref. 35).

That value then does real work. The authors assume a deformation energy ε = Σd² — their words: "We assume the deformation energy ε = Σd², which should be the correct order of magnitude" — and compare it against thermal energy to obtain an effective temperature Teff = kBT/ε. This is the comparison that separates a glass transition, driven by thermal rearrangement, from a jamming transition, which is purely geometric. Σ also normalises the yield-stress axis in Fig. 5(b) as σ₀ = σ_y d / Σ. Note that ε is a modelled quantity, not a measured one: Σ is the only measured input to it, and the droplet diameter d comes from SEM.

The effective temperature is a bracket, not a number, and the authors say so twice over. Their first estimate, using ε = Σd², gives kBT/ε = (5.2–20.0) × 10⁻⁶ across the droplet sizes studied. They then argue that thermal fluctuations need only change a droplet's surface area slightly rather than create the whole surface from nothing, which gives ε = 0.01πΣd² — "a factor of 30 smaller than our earlier estimate" — and a revised range of kBT/ε = (1.7–6.4) × 10⁻⁴. There is a third figure in the paper: the caption to Fig. 4(a) reports Teff = 5 × 10⁻⁶ for the 1.03 µm sample down to 1.3 × 10⁻⁶ for the 2.03 µm sample, a range four times lower than the Results text gives for the same samples. Working the arithmetic from the paper's own stated inputs — Σ = 3 mN/m, room temperature — kBT/Σd² comes out at (0.33–1.3) × 10⁻⁶, another factor of four below the caption. Each of the three published statements sits a factor of four above the last. The paper's conclusion survives all three, because every one of them lands in the crossover regime the simulations predict, but any page quoting a single effective temperature from this study is quoting one of three.

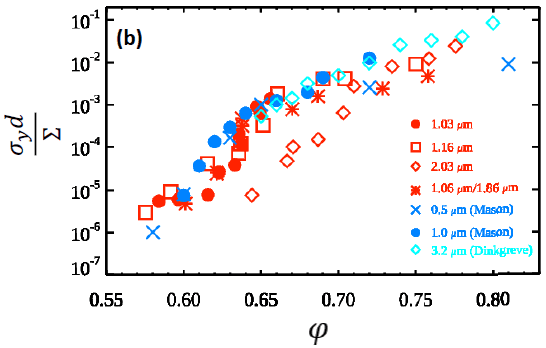
The rest of the paper is not this instrument's. Every flow curve, every yield stress, every Herschel–Bulkley and Three Component fit came from an Anton Paar MC302 rheometer running a 50 mm cone-plate geometry at 25 °C; droplet diameters and polydispersity came from a Topcon DS-150F field-emission SEM; volume fractions came from a balance. The Dropometer contributed one number to a paper with five figures and twenty-five panels. What that number bought is specific and worth stating: the paper's ability to compare its data against earlier emulsion studies. The authors note that in prior work "the large and small emulsion samples used different oils (thus with different surface tensions), so it was difficult to directly compare the rheological data between the samples" — Fig. 5(b) puts this study's data on the same axes as Mason et al. (Σ = 9.8 mN/m) and Dinkgreve et al. (Σ = 1.5 mN/m) precisely because each dataset's own surface tension is known.

Method Snapshot

Notes: Σ = 3 mN/m is a single measured value applied unchanged to all four samples — the paper reports no replicate count and no error bar for it, and validates it by agreement with previous work (ref. 35). Because Σ is identical across every row, it does no sample-to-sample discriminating work within this study; the paper notes that "for our own data at least, kBT and Σ are constant, so the difference between the two scalings is a factor of d³ in (a) and d¹ in (b)." Σ's value matters in two other ways: it fixes the absolute scale of the effective temperature, and it is what allows Fig. 5(b) to compare these samples against literature datasets measured on oils with different surface tensions (9.8 mN/m and 1.5 mN/m).

System / series (paper wording) Droplet sizes used in rheology (as reported) Composition / preparation details stated in paper Surface-tension input from Dropometer Quantities derived from Σ (modelled, not measured) Instruments Conditions (as stated) Notes
Concentrated TPM oil-in-water emulsions (monodisperse) dmean = 1.03 µm Prepared by a seeded-growth method; stabilized with 0.5 wt% F108 and 5 mM sodium chloride Σ = 3 mN/m Teff = kBT/ε with ε = Σd²; nondimensional yield stress σ0 = σy d / Σ Anton Paar MC302 rheometer; pendant drop method (Dropometer, made by Dropletlab) Rheology at room temperature (25 °C); 50 mm cone-plate, 1.01° cone angle, 53 µm truncation, roughened bottom plate, solvent trap; 10 s⁻¹ pre-shear for 30 s then 30 s at rest; γ̇ from 10² to 10⁻³ s⁻¹. No temperature or other condition is stated for the pendant-drop surface-tension measurement. Droplet diameters reported based on SEM measurements of polymerized droplets
Concentrated TPM oil-in-water emulsions (monodisperse) dmean = 1.16 µm Prepared by a seeded-growth method; stabilized with 0.5 wt% F108 and 5 mM sodium chloride Σ = 3 mN/m Teff = kBT/ε with ε = Σd²; nondimensional yield stress σ0 = σy d / Σ Anton Paar MC302 rheometer; pendant drop method (Dropometer, made by Dropletlab) Rheology at room temperature (25 °C); 50 mm cone-plate, 1.01° cone angle, 53 µm truncation, roughened bottom plate, solvent trap; 10 s⁻¹ pre-shear for 30 s then 30 s at rest; γ̇ from 10² to 10⁻³ s⁻¹. No temperature or other condition is stated for the pendant-drop surface-tension measurement. SEM imaging performed after polymerizing a portion of each sample (AIBN; 80 °C oven for at least 2 hours)
Concentrated TPM oil-in-water emulsions (monodisperse) dmean = 2.03 µm Prepared by a seeded-growth method; stabilized with 0.5 wt% F108 and 5 mM sodium chloride Σ = 3 mN/m Teff = kBT/ε with ε = Σd²; nondimensional yield stress σ0 = σy d / Σ Anton Paar MC302 rheometer; pendant drop method (Dropometer, made by Dropletlab) Rheology at room temperature (25 °C); 50 mm cone-plate, 1.01° cone angle, 53 µm truncation, roughened bottom plate, solvent trap; 10 s⁻¹ pre-shear for 30 s then 30 s at rest; γ̇ from 10² to 10⁻³ s⁻¹. No temperature or other condition is stated for the pendant-drop surface-tension measurement. Used in the paper’s discussion of a jamming-like transition and scaling in Fig. 5(b)
Concentrated TPM oil-in-water emulsions (bidisperse) dsmall = 1.06 µm, dlarge = 1.86 µm (1:1 ratio in volume) Prepared by a seeded-growth method; stabilized with 0.5 wt% F108 and 5 mM sodium chloride Σ = 3 mN/m Nondimensional yield stress scaling in Fig. 5(b) Anton Paar MC302 rheometer; pendant drop method (Dropometer, made by Dropletlab) Rheology at room temperature (25 °C); 50 mm cone-plate, 1.01° cone angle, 53 µm truncation, roughened bottom plate, solvent trap; 10 s⁻¹ pre-shear for 30 s then 30 s at rest; γ̇ from 10² to 10⁻³ s⁻¹. No temperature or other condition is stated for the pendant-drop surface-tension measurement. For Fig. 5(b), the paper states d = 1.06 µm is used to scale the bidisperse data

Key Findings

Pendant-drop surface tension reported for TPM

The authors report TPM surface tension as Σ = 3 mN/m, measured using "the pendant drop method (Dropometer, made by Dropletlab)," and state that the result "is consistent with previous work" — the comparison is to Kraft et al., J. Phys. Chem. B 2011, 115, 7175 (the paper's ref. 35). The value is reported once, with no replicate count and no error bar; literature agreement is its only stated validation.

Σ feeds an assumed deformation-energy scale for Teff

Using ε = Σd², the paper reports kBT/ε = (5.2 − 20.0) × 10−6 for the largest to smallest droplets and describes this as lying in a crossover regime discussed in connection with simulation results.

Alternative ε estimate also depends on Σ

The authors then hedge their own estimate. Opening "A more cautious approach suggests that the effective temperature may be larger than the above considerations," they argue that thermal fluctuations need only change a droplet's surface area slightly rather than create it from nothing — "If a diameter fluctuation Δd/d = 0.1 is sufficient to allow a droplet to move past another" — giving ε = 0.01πΣd², "a factor of 30 smaller than our earlier estimate," and kBT/ε = (1.7 − 6.4) × 10⁻⁴. Both ranges fall inside the crossover regime the simulations predict, so the paper's conclusion holds either way, but the effective temperature is a bracket rather than a number and the authors present it as one.

Yield-stress scaling uses Σ directly

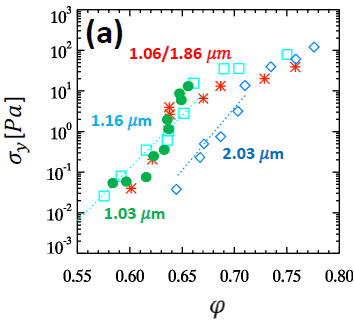
The paper defines a nondimensional mechanical yield stress σ₀ = σ_y d / Σ and presents yield stress versus φ nondimensionalised by the oil–water surface tension Σ in Fig. 5(b). The authors are explicit that it does not fully work: "Neither the thermal yield stress [Fig. 5(a)] nor the mechanical yield stress [Fig 5(b)] collapse the data perfectly." The Σ-normalised plot collapses their own samples well for φ ≳ 0.72 — the regime where droplets must deform — and collapses the combined dataset "fairly well even for lower volume fractions, with the sole exception being our large droplet sample with d = 2.03 µm."

Two distinct transitions in the same material, set by droplet size (Anton Paar MC302 rheometer)

The paper's headline result. Emulsions with droplets near 1 µm show a yield stress from φ ≈ 0.575, consistent with a glass transition at φ_g ≈ 0.58, and a further dramatic rise in yield stress at a jamming transition near φ_J ≈ 0.64. The 2.03 µm sample shows only jamming, with φ_c = 0.635 ± 0.008. The bidisperse sample behaves like the small-droplet samples, suggesting the small droplets dominate. The stated conclusion: "Our results show that liquid-solid transitions in dispersions are not universal, but depend on particle size." All of this was measured on the rheometer; the surface tension value is what puts the two transitions on a common energy scale.

The raw rheology does not collapse onto a master curve (Anton Paar MC302 rheometer)

The Herschel–Bulkley and Three Component models fit the data within 10% of each other in least-squares error, so the yield stress is robust to model choice. But the HB flow index n varies strongly with volume fraction — near 1 at low φ, falling to 0.4–0.5 at the highest φ — and the authors note "We are unaware of any other data set with n varying so strongly with φ." Because the fitting parameters depend on φ, "our raw rheological data would not collapse onto a master curve," in contrast with prior hydrogel-particle work where n ≈ 0.5 was essentially constant.

Thresholds / Regimes

The paper discusses transition volume fractions in terms of yield-stress onset behavior across volume fraction φ and connects these to glass-like and jamming-like transition points used in the study’s interpretation.
Threshold / regime (paper wording) Value Units Sample / context (as stated) How determined / stated in the paper Where shown / referenced
Glass transition φg ≈ 0.58 Discussed as a glass transition point for small thermal particles and used in the paper’s interpretation Given as φc = φg ≈ 0.58 in the study framing and used again in Conclusions Abstract; Conclusions
Jamming transition φJ ≈ 0.64 Discussed as a jamming transition point for large athermal systems and used in the paper’s interpretation Given as φc = φJ ≈ 0.64 in the study framing and used again in Conclusions Abstract; Conclusions
Transition volume fraction for large droplet sample φc = 0.635 ± 0.008 (relative), with an additional ±0.02 systematic Large monodisperse droplets (dmean = 2.03 µm) Bracketed using φ = 0.643 (yield stress) and φ = 0.627 (no yield stress), with φc reported between these values Results discussion near Fig. 2(a,b)
TC-model component transition φ ≈ 0.70 “Athermal” sample with only a jamming transition (paper wording) The paper states the TC model fit "transitions from needing only a viscous component (φ 0.70)." Results discussion

Figures & Visuals

What it shows

What it shows

Yield stress versus volume fraction, nondimensionalised as σ₀ = σ_y d / Σ. This is the only panel in the paper whose axis carries the measured surface tension. Each series is normalised by its own oil's tension — this study's measured 3 mN/m, Mason et al.'s 9.8 mN/m and Dinkgreve et al.'s 1.5 mN/m — which is what makes the three datasets comparable at all. The authors report that the collapse is good for their samples at φ ≳ 0.72 and reasonable for the combined data at lower φ, "with the sole exception being our large droplet sample with d = 2.03 µm."

What it shows

What it shows

Yield stress versus volume fraction for all four samples, each labelled by mean droplet diameter — the figure that shows the small-droplet samples retaining a yield stress down to φ ≈ 0.58 while the 2.03 µm sample loses it below 0.643. Its caption is also where the surface tension surfaces numerically: "The effective temperature ranges from Teff = 5 × 10⁻⁶ for the d = 1.03 µm sample to 1.3 × 10⁻⁶ for the d = 2.03 µm sample." Note that this caption range is four times lower than the range the Results text gives for the same samples, (5.2 − 20.0) × 10⁻⁶. Panel (b) of this figure is a simulation result reprinted from Ikeda, Berthier and Sollich (Phys. Rev. Lett. 109, 018301) and contains no experimental data from this study.

Why It Matters

A central goal of the paper is to compare glass-like and jamming-like rheological transitions across emulsions with different droplet sizes while keeping the emulsion formulation consistent (same oil, continuous phase fluid, and surfactant across samples). Within this framework, the surface tension Σ provides a single interfacial-material parameter used in the paper’s scaling arguments.

The reason a single interfacial number matters here is comparability. The authors point out that in earlier work the question could not be settled because "the large and small emulsion samples used different oils (thus with different surface tensions), so it was difficult to directly compare the rheological data between the samples." Measuring Σ on this system removes that obstacle: it fixes the deformation-energy scale ε against which thermal energy is judged, and it puts this study's yield stresses on the same axes as datasets measured on oils at 9.8 mN/m and 1.5 mN/m. Whether a dense emulsion stops flowing at φ ≈ 0.58 or φ ≈ 0.64 turns out to depend on droplet size, and the surface tension is the parameter that tells a formulator which regime they are in.

It is worth being precise about the size of that contribution. The Dropometer produced one scalar in a paper with five figures; the rheometer produced every data figure and the SEM produced the droplet sizes. The surface tension is identical across all four of this study's samples, so within this dataset it separates nothing — the authors note that "for our own data at least, kBT and Σ are constant." Its work is done at the boundaries of the study: setting the absolute energy scale, and connecting these results to the wider literature. That is a small share of the measurements and a large share of the interpretation.

Practical Takeaways

Pendant-drop Σ can be a key scaling input

Here, a single TPM surface-tension value (Σ = 3 mN/m) measured by "the pendant drop method (Dropometer, made by Dropletlab)" is used in two places: the assumed deformation energy ε = Σd² behind the effective temperature, and the mechanical normalisation σ₀ = σ_y d / Σ in Fig. 5(b). If you are running the same comparison, measure Σ on your own system rather than taking a literature value — the three emulsion studies compared in Fig. 5(b) span 1.5 to 9.8 mN/m for chemically similar oil-in-water systems.

Use Σ with droplet size to estimate kBT/ε

The study uses ε = Σd² (and also ε = 0.01πΣd² under a stated Δd/d = 0.1 assumption) to compute kBT/ε ranges for the droplet sizes studied. The two choices differ by a factor of 30 — (5.2 − 20.0) × 10⁻⁶ versus (1.7 − 6.4) × 10⁻⁴ — and the authors describe the second as the "more cautious" one. Treat the effective temperature as an order-of-magnitude bracket, which is how the paper treats it: ε = Σd² is assumed and "should be the correct order of magnitude."

Normalize yield stress with Σ for mechanical scaling

The paper defines σ₀ = σ_y d / Σ and shows yield stress nondimensionalised by Σ in Fig. 5(b) to compare behaviour across droplet sizes and datasets. Expect partial success: the paper states that neither this normalisation nor the thermal one "collapse the data perfectly," with the authors' own 2.03 µm sample the one outlier that will not fall onto the combined curve. The Σ normalisation is the right one above φ ≈ 0.72, where droplets must deform; below random close packing the surface tension should be irrelevant and the thermal scaling applies instead.

Keep formulation constant when comparing size effects

The experiments are framed around using the same oil for the droplets, the same continuous phase fluid, and the same surfactant for all samples while varying droplet diameter.