Glass Cleaning Validation and Verification Protocol for Pharmaceutical Glassware
Add a quantitative, real-time surface cleanliness check to your cleaning validation program. Stop contamination that traces back to residual film, oxide-like drift, or uneven cleaning coverage — before an analytical result comes back.

Who this is for: QA/QC teams, validation engineers, and manufacturing leads validating cleaning effectiveness on pharmaceutical glassware and process equipment.
Positioning: Dropometer strengthens your cleaning validation protocol. It does not replace chemical identification methods (TOC, HPLC, FTIR) — it adds a fast, quantitative surface-wetting screen that catches contamination and drift before the analytical result comes back.
Droplet Lab Team
Droplet Lab builds precision instruments and software for surface science measurement, specialising in contact angle analysis and surface tension characterisation. Used by researchers across materials science, pharmaceuticals, coatings, and advanced manufacturing, Droplet Lab's Dropometer has contributed to studies published in peer-reviewed journals including Advanced Functional Materials (Impact Factor 19). The team combines instrument engineering with deep domain knowledge in wettability science with a focus on practical accuracy.
The Cost Of Getting It Wrong
10×
higher hidden cost vs. visible scrap cost: rework, re-inspection, downtime, and warranty claims are rarely captured
Lean Six Sigma research consensus
$1 → $10
upstream prevention typically saves $10 in internal rework and up to $100 in external warranty and recall costs, for the specific failure modes an upstream screen actually catches
COPQ prevention-to-failure ratio
Sources: ASQ, Learn Lean Sigma, Fabrico COPQ Guide 2026. Figures are industry-wide benchmarks, not Droplet Lab claims. This page's own scope note: contamination detected by a wetting screen is one contributing cause among several that drive pharmaceutical cleaning validation failures, batch rejections, and audit findings.
What this workflow does and what it does not
Quick technical reference for engineers and QA managers evaluating fit before reading further.
Evidence Box (QC-Ready)
Undetected surface contamination on cleaned glassware, discovered only after a delayed analytical result, a failed cleaning validation run, or a batch rejection.
A rapid, line-side cleanliness verification check integrated as an upstream gate inside an existing cleaning validation program. Not a replacement for analytical confirmation testing.
Water contact angle at a fixed time after cleaning
Spot-to-spot variability across zones (IQR/SD)
Optional surface energy trend using Fowkes, Equation of State, or van Oss-Good models
Optional surface tension check for cleaning solutions
10–20 representative samples spanning pass and fail (known-contaminated) outcomes
Minimum 2 operators
Locked probe fluid, droplet volume, capture time, and replicate count, tracked per equipment/surface type and cleaning process
PASS / MONITOR / FAIL thresholds must be set by correlating measured wetting signals to your actual analytical test results (TOC, HPLC, FTIR) and quality outcomes; surface- and process-specific, not universal.
Contact angle is a process-risk indicator, not chemical identification of the contaminant. Cleaning agent chemistry and process design require separate process controls.
What are you trying to solve?
The Dropometer serves four roles across a pharmaceutical glass cleaning validation program. Each has a different primary risk.
Process Engineer
Investigating batch-to-batch or shift-to-shift variation in cleaning validation results with no clear root cause, especially after a change in cleaning chemistry or process parameters.
QA / QC Manager
Needing a numeric upstream gate before releasing cleaned equipment to reduce failed validation runs and batch rejections.
Compliance Officer
Requiring documented, defensible evidence of cleaning effectiveness for CAPA responses, deviation reports, or regulatory audits under equipment-cleaning requirements such as 21 CFR 211.67.
Validation / Lab Manager
Setting up a reproducible measurement protocol for cleaning verification across operators, shifts, and equipment types.
Is this the right screen for your process?
This is not a universal solution. Check the conditions below before investing further time.
Good fit if
Less relevant if
Why Cleaning Validation Failures Start Before the Analytical Result Comes Back
In most pharmaceutical cleaning validation programs, contamination is discovered late. Some of it is visible early with the right upstream gate, some of it isn't.
Pharmaceutical cleaning validation typically relies on analytical methods (TOC, HPLC, FTIR, gravimetric swab or rinse testing) that are accurate but slow, and on the water-break test, which is fast but qualitative; the pass/fail call depends on an operator's read of water sheeting off a surface, with no numeric record. Contact angle measurement sits between the two: fast enough to run at the line, quantitative enough to trend, document, and defend.
Common upstream causes of cleaning validation failure include residual cleaning agent or product film from incomplete rinsing, an ineffective cleaning process design, equipment surface condition differences between vessels, manual cleaning variability between operators or shifts, and post-clean contamination from handling or storage. All of these are detectable, at least as a wetting-behavior signal, before the batch moves to the next process step.
The honest limit: contact angle detects that a wettability change occurred, consistent with contamination. It does not identify what the contaminant is, and it does not replace the analytical methods your protocol specifies. Root causes such as cleaning agent chemistry problems and equipment design issues (dead-legs, drainage) still require the rest of your cleaning validation program to resolve; this screen is one upstream gate, not the whole program.
What Does a Cleaning Validation Failure Actually Look Like?
Many teams struggle with intermittent cleaning validation failures because the written procedure hasn't changed but the outcome still varies. Contamination or drift can produce failures that look random from the outside.
Root Causes
Why:
- Incomplete rinsing leaves surfactant or active-ingredient residue on the surface, changing wetting behavior independent of whether the bulk cleaning cycle ran correctly.
How to detect:
- Contact angle rises above your known-clean baseline Replicate spread (IQR/SD) increases across zones Re-cleaning a sample improves wetting measurably
Corrective action:
- Adjust cleaning agent concentration, rinse volume, or rinse cycle count Add no-touch handling rules for cleaned surfaces Re-check surfaces immediately after cleaning
Why:
- The cleaning procedure itself (dwell time, agitation, temperature) is under-specified or was never validated against the actual soil load.
How to detect:
- High contact angle variability across replicate runs Failures that persist across multiple otherwise-correct executions of the same written procedure
Corrective action:
- Redesign and re-validate the cleaning protocol, not just re-clean the current lot Correlate parameter changes (dwell time, agitation) against contact angle trend data
Why:
- Roughness, wear, etching, or coating differences between vessels or fixtures change baseline wettability independent of cleanliness.
How to detect:
- Persistent variability that survives repeated cleaning Differences correlated with equipment age or surface type rather than with the cleaning cycle
Corrective action:
- Segment acceptance criteria by surface type rather than using one threshold for all equipment Track individual equipment units against their own baseline over time
Why:
- Operator-to-operator or shift-to-shift technique differences change real-world cleaning outcomes even when the written procedure is followed.
How to detect:
- Contact angle results correlated with operator or shift identity Wider variability on manually-cleaned equipment vs. automated lines
Corrective action:
- Standardize technique training Evaluate automation of the cleaning step where feasible
Why:
- Handling, environmental exposure, or storage reintroduces contamination after a genuinely clean bake.
How to detect:
- Clean baseline immediately after cleaning that degrades on a later re-check Degradation correlated with storage time or handling exposure rather than with the cleaning step
Corrective action:
- Control handling, covering, and storage conditions between cleaning and use Set a maximum hold time before re-verification is required
Why:
- If contact angle variability persists after the five causes above have been ruled out, the residue is behaving like a wetting problem but the underlying cause may be chemical; a residue class contact angle can't distinguish, or an equipment design issue (dead-leg, drainage) contact angle wasn't built to catch.
How to detect:
- Wetting signal stays abnormal after cleaning-process, equipment-segmentation, and handling causes have all been addressed
Corrective action:
- Escalate to full analytical identification (TOC, HPLC, FTIR) rather than continuing to iterate on the cleaning procedure alone Review equipment design for dead-legs or drainage issues if the pattern is equipment-specific rather than lot-specific
Not sure which root cause applies to your process?
A surface science specialist can review your failure history and help you identify whether a surface screen would add a useful upstream gate.
Building a defensible cleaning validation record
Surface readiness measurement produces the type of numeric, traceable output that a subjective water-break call cannot. If your quality system requires documented evidence of process control for deviation reports, CAPA files, or regulatory audits, contact angle measurement provides that evidence in a format your QA documentation already requires. This supports, but does not by itself satisfy, the written-procedure and pre-use inspection expectations under 21 CFR 211.67 — your full cleaning validation program remains the compliance basis.
Audit trail
Numeric contact angle and variability values with replicate spread, timestamps, operator records, and equipment/lot identification; replacing subjective "surface looked clean" notes with defensible numeric logs.
CAPA evidence
When cleaning validation failures trigger a Corrective and Preventive Action file, contact-angle and variability data provide quantitative before/after evidence of surface condition, not anecdotal process descriptions.
Deviation documentation
Deviation reports that include numeric cleaning-verification data allow you to assign root cause to the cleaning step with evidence, not inference.
Equipment qualification
Contact angle measurement provides a numeric acceptance criterion for requalifying equipment after a cleaning process change, applicable to equipment-cleaning documentation under 21 CFR 211.67.
Process control records
Contact-angle and IQR trend logs demonstrate statistical process control at the cleaning step; relevant to Six Sigma, SPC, and DMAIC programs targeting cleaning-validation COPQ.
Water-break test upgrade
Where a qualitative water-break check (ASTM F22) is currently the only line-side test, contact angle measurement (ASTM C813) gives the same rapid check a numeric, trendable value instead of a visual pass/fail call.
What to Measure
Water Contact Angle at fixed time after cleaning
Why it matters: This is the fastest screen for whether a surface is behaving like a clean surface should, relative to a known-clean baseline.
How to interpret: Lower angle generally indicates a cleaner, more hydrophilic surface; a higher or more variable angle indicates contamination risk.
When it is not enough: Confirms wetting behavior, not the identity of any residue present.
Spot-to-spot variability (IQR/SD)
Why it matters: A single average can hide a localized contamination spot or an uneven cleaning zone. Variability is often what reveals intermittent failure.
How to interpret: Low variability suggests uniform cleaning. High variability suggests contamination, uneven cleaning coverage, or handling effects.
When it is not enough: High spread signals a non-uniform surface but does not identify whether the cause is contamination, coverage, or handling.
Surface Energy Trend
Why it matters: Dropometer supports surface energy analysis using Fowkes, Equation of State, or van Oss-Good models, useful for comparing cleaning processes or equipment surfaces over time.
How to interpret: Surface energy values are model-dependent and most useful as comparative indicators between runs or equipment, not absolute cross-lab numbers.
When it is not enough: Not chemical identification of the contaminant and should not replace root-cause confirmation methods.
Surface Tension of Cleaning Liquids
Why it matters: Cleaning agent degradation, dilution error, or contamination of the cleaning solution itself can undermine an otherwise-correct cleaning cycle.
How to interpret: A deviation from the expected value indicates process drift upstream of the equipment being cleaned.
When it is not enough: Does not by itself confirm the equipment surface is clean.
Validated Measurement Approach
Independent benchmarking and publication-based validation references.
Benchmark Validation
Dropometer contact angle and pendant-drop surface tension methods have been benchmarked against KRÜSS DSA100E reference measurements. The instrument is referenced in peer-reviewed journals including Bioactive Materials (Impact Factor 20) and Advanced Functional Materials (Impact Factor 19). Ink viscosity itself should still be measured with the manufacturer's or industry-standard viscosity method, Dropometer does not provide that measurement.
See peer-reviewed validationPublication Evidence
Our instruments are referenced in peer-reviewed journals, theses, and conference publications.
Browse citationsHow Dropometer Fits Your Workflow
Dropometer is best used as a cleaning-verification QC screen and as a structured troubleshooting step when cleaning validation results begin to trend.
Define measurement points
After cleaning, before release: Place sample on instrument, lock lighting and level Run fixed droplet method with locked volume and probe fluid Record median contact angle across at least 5 spots per zone
Run cleaning verification screening
Measure contact angle and map variability across the equipment: PASS: surface matches baseline band → release for next process step MONITOR: borderline result → repeat measurement, check handling and elapsed time since cleaning FAIL: wetting drift or high variability → hold, re-clean or re-treat, escalate to analytical testing if it recurs Document decision and measurement values in the QC log
Diagnose issues
Use the signal pattern to isolate cause: High angle indicates contamination or incomplete cleaning High variability indicates uneven cleaning coverage or handling damage Stable wetting plus a later analytical failure suggests a chemical-identity issue outside this screen's scope
Control changes
Build site-specific, defensible thresholds: 10–20 representative samples spanning pass and fail outcomes At least 2 operators to prove repeatability Include a known-good control coupon measured on every run Track wetting metrics whenever you change cleaning agent, cycle parameters, or equipment
We completed our gage R&R study on the unit and it performed very well.
Brandon Barbee
Corporate Quality Engineer - Zeus Industries - Polymer Manufacturing
Download the Cleaning Verification SOP Template
An editable SOP template your team can adapt for your equipment, cleaning agent, and process. Includes measurement protocol, gate-setting guidance, and a QC log format ready for your documentation system.
Sample Cleaning Verification Log: Multiple Zones, Same Equipment Run
Representative output format. Values are illustrative, not a universal specification.
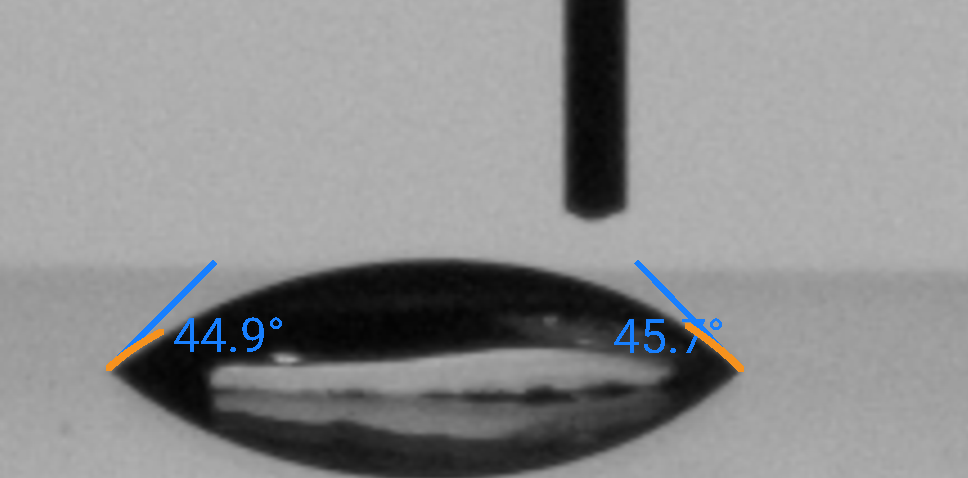
Dropometer contact angle measurement — DI water on glass. Left contact angle and right contact angle shown with fitted tangent lines at each contact point and the baseline overlay. This is the type of output used to make a cleaning-verification release decision.
Sample Cleaning Verification Log: Multiple Zones, Same Equipment Run
| Zone | Contact Angle (°) | Replicate SD | vs. Baseline |
|---|---|---|---|
| Zone A — Vessel wall, centre | 12.4° | ±1.1° | Within range |
| Zone B — Vessel wall, centre repeat | 13.0° | ±1.3° | Within range |
| Zone C — Neck/seam near closure | 34.6° | ±4.2° | +21.6° above baseline |
| Zone D — Base, residual detergent film | 58.9° | ±6.7° | +45.9° above baseline |
| Zone E — Vessel wall, 24h post-clean, stored uncovered | 28.3° | ±2.9° | +15.9° above baseline |
Zone D indicates residual detergent film at the base; unit held for re-cleaning before release. Zone E shows contact angle drifting upward 24 hours after cleaning while stored uncovered, consistent with post-clean contamination rather than a fresh cleaning failure. Zones A and B cleared; Zone C flagged for follow-up check. This output would be included in the cleaning validation record for this equipment run.
Cleaning validation failure troubleshooting guide
Start condition: cleaning validation failures, deviation reports, or contamination complaints are increasing. Use the signal pattern to identify the most likely cause.
Contact angle is high versus your established baseline
Likely cause: Residual cleaning agent or product film, incomplete rinsing, or an under-run cleaning cycle.
Action: Hold affected equipment. Re-clean, then re-measure promptly. If angle drops significantly after re-treatment, residue was the cause. Investigate the point in the cleaning cycle where it broke down.
Median looks acceptable but replicate spread (IQR/SD) is high
Likely cause: Uneven cleaning coverage, a localized contaminant, or handling damage at specific zones.
Action: Test fixed locations — centre, seams, known handling points. Isolate the source by zone. Correct cleaning coverage or handling procedure and revalidate.
Wetting looks normal but analytical or deviation failures continue
Likely cause: A chemical-identity issue this screen cannot distinguish, or an equipment design issue (dead-leg, drainage) rather than a surface-wetting problem.
Action: Escalate to full analytical testing (TOC, HPLC, FTIR). Review equipment design if the pattern is equipment-specific rather than lot-specific — this instrument's reading does not screen for either directly.
Angle rises measurably across a hold or storage period
Likely cause: Post-clean contamination from handling, environment, or storage.
Action: Shorten the hold time before use or re-verification; control covering and storage conditions between cleaning and use.
Common questions before adoption
No. It is a fast, upstream physical-wetting screen that runs in addition to those methods, not instead of them. Your validation protocol's specified analytical methods remain the confirmatory test.
There is no universal threshold. You establish your own PASS / MONITOR / FAIL gates by correlating measured contact angle to your analytical results and quality outcomes for your own equipment and cleaning process.
A five-spot contact angle check typically takes under 10 minutes including setup, measurement, and logging, and can run immediately after cleaning without a dedicated lab environment.
No. It tells you the surface is behaving differently than a known-clean baseline. Identifying the specific residue requires your analytical methods.
It supports the equipment-cleaning documentation expectations under 21 CFR 211.67, which requires written procedures and a pre-use cleanliness check, by giving you a numeric, traceable record instead of a purely visual water-break call (ASTM F22). It does not by itself satisfy the full cleaning validation requirement, which depends on your complete program.
The water-break test (ASTM F22) is a qualitative pass/fail visual check. Contact angle measurement (the same underlying physics, formalized in ASTM C813 for glass) replaces that judgment call with a number you can trend, document, and defend in an audit.
Yes. The Dropometer produces numeric contact-angle and variability logs with replicate data, timestamps, and operator records. These outputs can be included in deviation reports, CAPA files, and equipment qualification records wherever numeric evidence of process control is required.
Instant ROI Snapshot
Cleaning Validation ROI Snapshot
Estimate audit, rejection, and recall risk exposure avoided.
Result
Annual exposure combines audit/CAPA cost, customer rejections, and recall probability; avoided exposure applies the risk reduction percentage.
What Contact Angle Measurement Cannot Tell You
Knowing the limits of any measurement tool is part of using it responsibly.
Use this page to improve prevention and upstream troubleshooting, not to oversimplify cleaning validation. The Dropometer is one layer in a quality system, not a substitute for one.
Similar surface readiness workflows
Surface Cleanliness Verification
The general-purpose version of this workflow, applied beyond pharmaceutical glassware to any equipment surface.
Silicone Contamination Detection
A related contamination-specific screen for silicone transfer, a common and hard-to-detect cause of cleaning and coating failures.
Corona Treatment Monitoring for Print Quality
Same trend-monitoring logic applied to surface treatment drift in a print production context.
How this page was created
Editorial and technical transparency notes for this page.
Drafting assistance
Initial draft created with AI assistance (ChatGPT 5.2 Pro), then rewritten for technical clarity.
Technical review
Reviewed and edited for technical accuracy by a surface-science specialist.
Verification steps
Identifiers, units, thresholds, and key claims checked against cited sources before publication.
Updates
Reviewed every 12 months or when the underlying standard changes.
Report a correction
Spotted an issue in this summary? Send a correction request and our team will review it.
Correction Request
We work hard to keep this standards summary accurate and up to date. If you spot an error (wrong revision/year, missing requirement, incorrect interpretation, or broken link), tell us and we'll review it.
Contact us to report a correction