Additive Manufacturing QC & Process Control
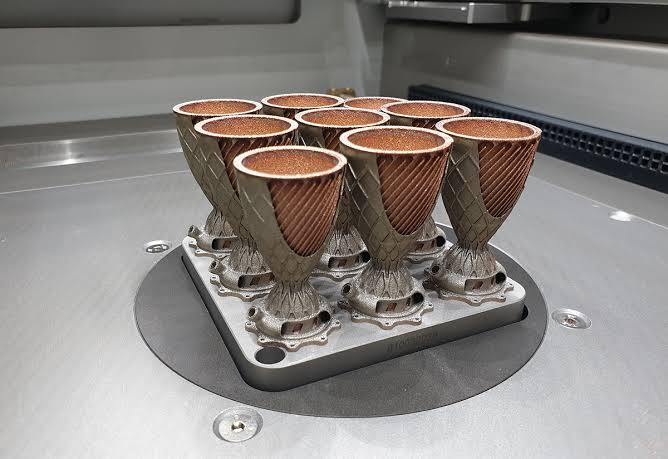
Powder Bed Fusion Additive Manufacturing: Powder Spreading and Bed Formation Stability Diagnostics
Catch powder condition drift, moisture pickup, oxidation, and contamination before they show up as recoater streaks, bare spots, or build defects, by screening powder surface behavior before it reaches the bed.
Written by
Gurdeep Singh Saini
Holds a BASc in Mechanical Engineering (Ryerson) and an MASc from York University. He focuses on the custom AI behind the instrument.
COO at Droplet Lab
Read More
Technical Review by
Droplet Lab Team
Droplet Lab builds precision instruments and software for surface science measurement, specialising in contact angle analysis and surface tension characterisation. Used by researchers across materials science, pharmaceuticals, coatings, and advanced manufacturing, Droplet Lab's Dropometer has contributed to studies published in peer-reviewed journals including Advanced Functional Materials (Impact Factor 19). The team combines instrument engineering with deep domain knowledge in wettability science with a focus on practical accuracy.
Read More
Reviewed By
Droplet Lab Team
Droplet Lab builds precision instruments and software for surface science measurement, specialising in contact angle analysis and surface tension characterisation. Used by researchers across materials science, pharmaceuticals, coatings, and advanced manufacturing, Droplet Lab's Dropometer has contributed to studies published in peer-reviewed journals including Advanced Functional Materials (Impact Factor 19). The team combines instrument engineering with deep domain knowledge in wettability science with a focus on practical accuracy.
Validated Measurement Approach
Independent benchmarking and publication-based validation references.
Benchmark Validation
Dropometer contact angle and pendant-drop surface tension methods have been benchmarked against KRÜSS DSA100E reference measurements. The instrument is referenced in peer-reviewed journals including Bioactive Materials (Impact Factor 20) and Advanced Functional Materials (Impact Factor 19).
See peer-reviewed validationPublication Evidence
Our instruments are referenced in peer-reviewed journals, theses, and conference publications.
Browse citationsSample Incoming Screening: Powder Condition and Reuse-Cycle Tracking
Representative output format. Values are illustrative, not a universal specification.
Actual measurement output
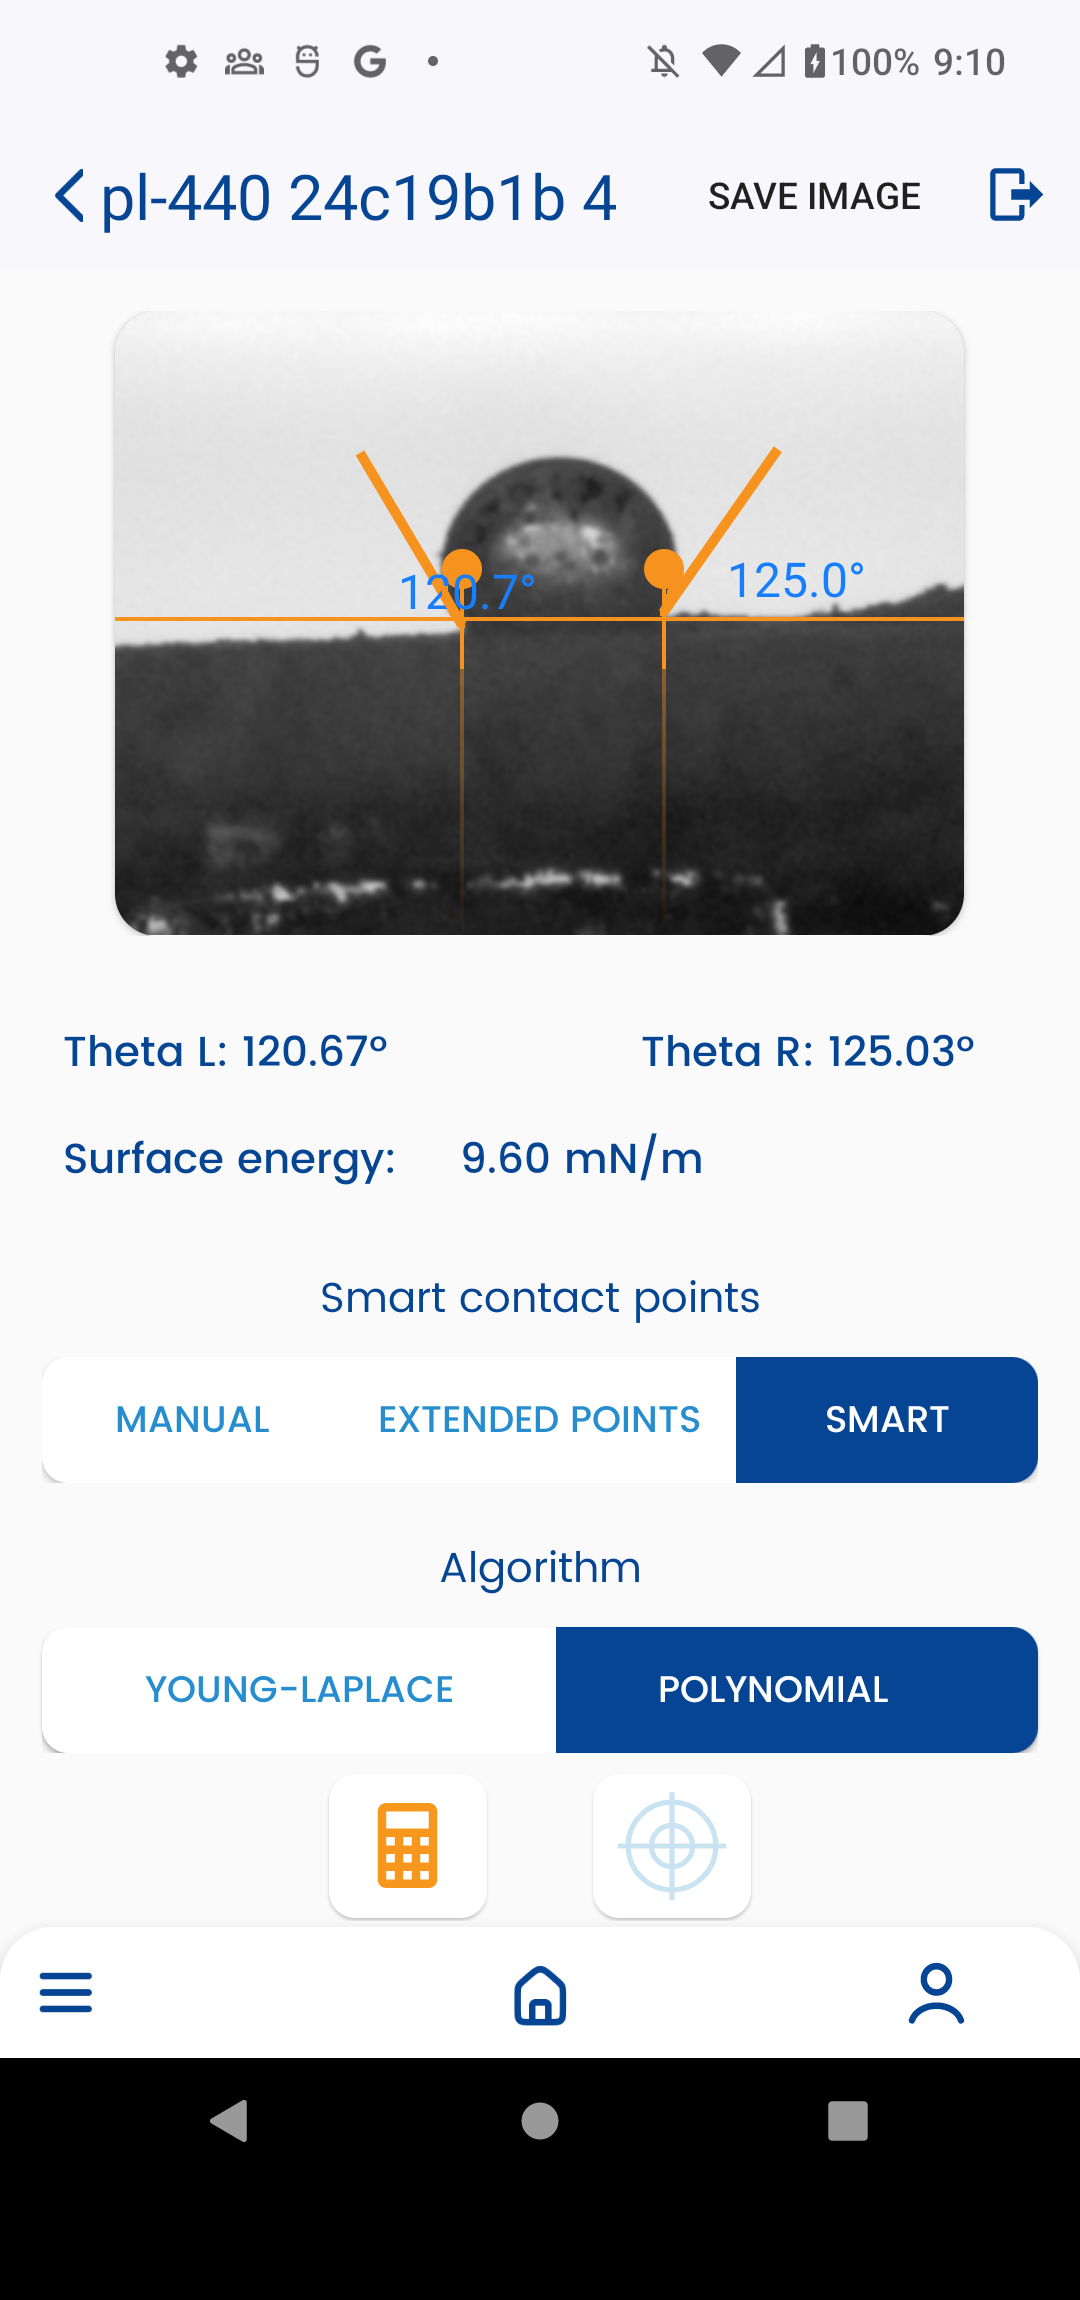
Dropometer contact angle and surface energy measurement on a powder lot. This is the type of output used to decide whether a powder lot proceeds to the next build or gets retired.
The fresh, unreused powder establishes the PASS baseline. Reuse cycle 5 shows a modest contact-angle rise consistent with early oxidation, still within a reasonable PASS range but worth tracking as a trend rather than a one-time reading. Reuse cycle 12 shows a larger shift and moderate variability, the MONITOR threshold this workflow is built to catch before a degraded lot reaches a full build. The moisture-exposed lot shows both a high contact angle and high variability together, a combination worth a FAIL decision pending drying or rejection. This output would be included in the powder qualification record used to decide whether a lot proceeds or is retired.
Report a correction
Spotted an issue in this summary? Send a correction request and our team will review it.
Correction Request
We work hard to keep this standards summary accurate and up to date. If you spot an error (wrong revision/year, missing requirement, incorrect interpretation, or broken link), tell us and we'll review it.
Contact us to report a correctionSources
1.
Measuring the spreadability of pre-treated and moisturized powders for laser powder bed fusion. Additive Manufacturing. https://www.sciencedirect.com/science/article/abs/pii/S2214860419304397
2.
Spreadability of Metal Powders for Laser-Powder Bed Fusion via Simple Image Processing Steps. Materials (MDPI), 15(1), 205 (2022). https://www.mdpi.com/1996-1944/15/1/205
3.
Chen, X. et al. Contact angle measurement with a smartphone. Review of Scientific Instruments, 89, 035117 (2018). https://pubs.aip.org/aip/rsi/article-abstract/89/3/035117/368179/Contact-angle-measurement-with-a-smartphone
4.
Surface tension measurement with a smartphone using a pendant drop. Colloids and Surfaces A: Physicochemical and Engineering Aspects. https://www.sciencedirect.com/science/article/abs/pii/S0927775717307744
5.
Fabrico. The Cost of Poor Quality (COPQ) in Manufacturing: 2026 Guide. https://www.fabrico.io/blog/cost-of-poor-quality-copq-manufacturing-guide/
6.
Making Strategy Happen. The Cost of Quality: The 1-10-100 Rule. https://www.makingstrategyhappen.com/the-cost-of-quality-the-1-10-100-rule/