Primary surface measurement reported
Surface tension of polymer–surfactant solutions measured at room temperature (reported as surface tension vs. surfactant concentration plots).

Client Citation Analysis
Surface tension of polymer–surfactant solutions measured at room temperature (reported as surface tension vs. surfactant concentration plots).
Section 2.4, verbatim: "The surface tension of the solutions was measured at room temperature using a smartphone-based tensiometer and the ADSA (Axisymmetric Drop Shape Analysis) method. The instrument was supplied by Droplet Lab, Markham, ON, Canada."
Surface tension vs. surfactant concentration curves (paired with conductivity curves) were used to discuss surface activity and to estimate approximate CAC (critical aggregation concentration) and PSP (polymer saturation point) based on slope changes.
Each solution’s surface tension was measured 12 times and averaged; the authors describe the measurements as “very consistent” and use this to support method reliability.
The Droplet Lab tensiometer measured surface tension only. The paper's headline result; how five surfactants change the steady shear rheology of two polymers came from a Fann 35A/SR 12 coaxial cylinder viscometer, and the paired conductivity data came from a Thermo Orion 3 Star meter. Of the paper's 25 figures, 12 are rheology only, 10 plot surface tension and conductivity together on shared axes, and 2 panels (19b and 25b) are surface tension alone.
Surface tension of aqueous polymer–surfactant solutions at room temperature, obtained from pendant-drop measurements analyzed using ADSA with a smartphone-based tensiometer
Electrical conductivity of polymer–surfactant solutions (used alongside surface tension to interpret concentration-dependent behavior).
Steady-shear rheology (shear stress vs. shear rate and viscosity vs. shear rate), including power-law model parameters K (consistency index) and n (flow behavior index).
Smartphone-based tensiometer (Droplet Lab, Markham, ON, Canada) using ADSA (Axisymmetric Drop Shape Analysis)
Fann 35A/SR 12 coaxial cylinder viscometer (Fann Instrument Company, Houston, TX, USA)
Thermo Orion 3 Star conductivity meter (Thermo Fischer Scientific Inc., Beverly, MA, USA)
The paper reports surface tension measured with "a smartphone-based tensiometer and the ADSA (Axisymmetric Drop Shape Analysis) method," with the instrument "supplied by Droplet Lab, Markham, ON, Canada" (Section 2.4). The paper does not name a product model. A pendant droplet is formed at the tip of a needle or capillary, back-illuminated, imaged at high resolution using a smartphone camera, and analyzed with specialized software that calculates surface tension numerically from the droplet geometry.
These surface-tension outputs are used throughout the “surface activity” results to compare surfactant effectiveness and to estimate approximate CAC and PSP values from changes in slope of surface-tension–concentration plots (often considered alongside conductivity plots).
Across polymer–surfactant mixtures, the surface tension decreases as surfactant concentration increases and tends to level off at higher concentrations. The authors interpret the initial decrease as adsorption at the air–water interface and the leveling behavior as saturation of the interface by surfactant–polymer complexes and surfactant molecules.
In the cross-surfactant comparisons (LR-400: Figure 19b; Praestol 2540TR: Figure 25b), Amphosol is identified as the most effective surfactant in reducing surface tension at a given concentration.
For surfactant/LR-400 polymer solutions, at any given surfactant concentration, the surface tension order reported is: Stepwet > Stepanol > HTAB > Alfonic > Amphosol.
For surfactant/Praestol 2540TR polymer solutions, at any given surfactant concentration, the surface tension order reported is: HTAB > Stepanol ≥ Stepwet > Alfonic > Amphosol.
The authors use changes in slope of surface tension vs. concentration plots (and paired conductivity plots) to estimate CAC and PSP values, and note that the plots do not show “sharp enough breaks” to draw definite conclusions; they also mention alternative methods (e.g., calorimetry or spectroscopy) as possible validation approaches.
Stepanol WA-100 and Stepwet DF-95 sharply raise the consistency index and lower the flow behaviour index of cationic LR-400 solutions above 100 ppm, making them more viscous and more shear-thinning. The authors attribute this to charge neutralisation and polymer chain entanglement between the oppositely charged pair.
None of the five surfactants strongly influences the rheology of anionic Praestol 2540TR. Interaction strength runs HTAB > Amphosol > Stepanol = Stepwet = Alfonic, with electrostatic repulsion between like-charged species suppressing any change in the network structure.
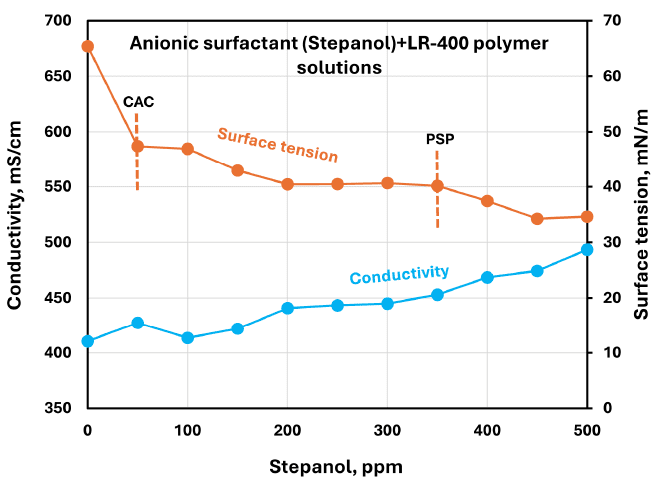
Shows electrical conductivity and surface tension versus Stepanol concentration in surfactant + LR-400 solutions, with CAC/PSP indicated in the plotted trends.
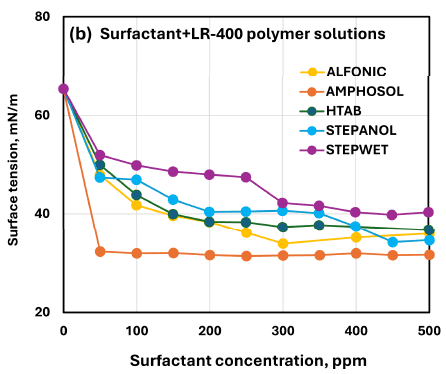
Compares surface tension behavior across the five surfactants at matched concentration in the LR-400 polymer solution, including the reported surface-tension ordering and identification of Amphosol as most effective.
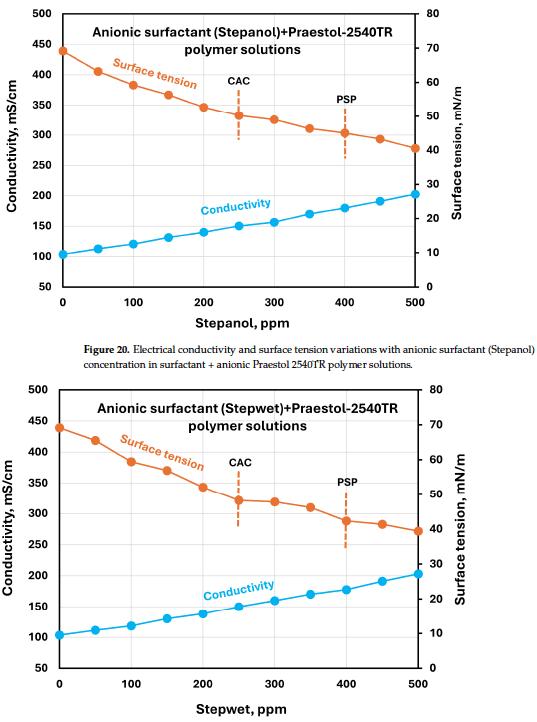
Shows electrical conductivity and surface tension versus Stepanol concentration in surfactant + Praestol 2540TR solutions, illustrating the concentration dependence used for CAC/PSP estimation.
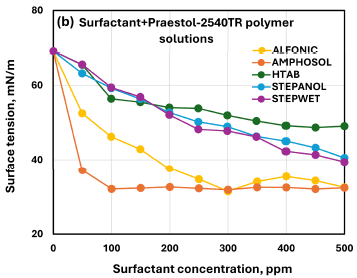
Compares surface tension behavior across the five surfactants at matched concentration in the Praestol 2540TR polymer solution, including the reported surface-tension ordering and identification of Amphosol as most effective.
The paper frames polymer–surfactant interactions as important for designing advanced fluid systems used in applications such as enhanced oil recovery, drilling, and chemical processing. Within that scope, the surface-tension measurements provide the “surface activity” component of the study, enabling direct comparison of how surfactant type influences the air–water interface behavior across the two polymer systems.
By pairing surface tension with conductivity versus surfactant concentration, the authors use the Dropometer (smartphone-based tensiometer with ADSA) to interpret adsorption/saturation behavior and to read approximate CAC and PSP regime markers from paired surface tension and conductivity curves. The authors are explicit that this pairing did not resolve the transitions cleanly: "The break points... are not sharp enough to estimate the critical aggregation concentration (CAC) and polymer saturation point (PSP) accurately," and they suggest calorimetry or spectroscopy as validation.
Amphosol CG is identified as the most effective surfactant for reducing surface tension at a given concentration in both LR-400 and Praestol 2540TR polymer solutions.
The paper describes surface tension curves that drop sharply at low surfactant concentration and level off at higher concentration, interpreted as interface saturation behavior.
The authors state the plots do not exhibit sharp enough breaks for definite CAC/PSP determination and present CAC/PSP values as approximate, with calorimetry/spectroscopy mentioned as potential validation approaches.
The paper notes that for Amphosol and Alfonic the surface tension drops sharply then levels off, while for Stepanol, Stepwet, and HTAB the decrease is more gradual in the Praestol 2540TR system.