Contents

Client Citation Analysis

Rheology of Cellulose Nanocrystal and Fumed Silica Suspensions: Influence of Ionic Surfactants

University of Waterloo researchers asked how an anionic and a cationic surfactant change the flow of cellulose nanocrystal and fumed silica suspensions between 0 and 500 ppm. They paired viscometer rheology with conductivity and pendant drop surface tension from a Droplet Lab smartphone based tensiometer. Surface tension breaks for the cationic surfactant HTAB, near 229 to 352 ppm depending on the suspension, marked where viscosity changed sharply; the anionic surfactant showed no break.

At-a-Glance Summary

Primary surface measurement reported

Surface tension in mN/m against surfactant concentration from 0 to 500 ppm in 50 ppm steps, for 1 wt% nanocrystal suspensions and 2 and 5 wt% fumed silica suspensions. Results are shown as plots; the only individual readings listed in the text are 13 repeats for one mixture.

Research question

Do low doses of an anionic (Stepanol, sodium lauryl sulfate based) or cationic (HTAB) surfactant change the flow behaviour of negatively charged nanocrystal and fumed silica suspensions, and can surface tension and conductivity locate where that change starts?

Headline finding

HTAB, which carries the opposite charge to both particles, raised the consistency index 20 to 70 fold at high doses. The surface tension break point shifted with the particle type and loading, and it lined up with the onset of the viscosity change and the conductivity break.

Paper Details

Authors
Rajinder Pal, Joshua Richards, Anuva Pal
Affiliation
Department of Chemical Engineering, University of Waterloo, Waterloo, Ontario, Canada
Journal
Nanomaterials (MDPI)
Year
2026
Volume
16
Issue / Article
Issue 11 (publisher page; not printed in the text), Article 676
Licence
Creative Commons Attribution (CC BY), as stated in the paper; version number not stated in the text, check publisher page
Pendant drop surface tension, steady shear rheology, electrical conductivity, dynamic light scattering
Measurement scope
Methods used
  • Surface tension: Droplet Lab smartphone based pendant drop tensiometer
  • Rheology: Fann 35A/SR 12 coaxial cylinder viscometer, about 1.5 to 1021 s^-1
  • Conductivity: Thermo Orion 3 Star meter
  • Particle size: Malvern Zetasizer Nano ZS90
Three particle loadings, two surfactants, 11 surfactant levels each
Samples tested
Suspensions
  • 1 wt% cellulose nanocrystals (CelluForce CelluRods 100P)
  • 2 wt% and 5 wt% hydrophilic fumed silica (Wacker, called N20)
  • Surfactant at 0, 50, 100 and up to 500 ppm in 50 ppm steps
  • Pure HTAB solutions in water for a reference cmc
One anionic and one cationic surfactant in deionized water
Liquids
Surfactants
  • Stepanol WA-100 (sodium lauryl sulfate based, anionic)
  • HTAB, hexadecyltrimethylammonium bromide (cationic)

Classification

This paper uses pendant drop surface tension as a marker for where surfactant and particle interactions start to change suspension flow.

What Was Measured

Primary surface / interfacial measurement

Air and liquid surface tension of each suspension and surfactant mixture, plus pure HTAB solutions, measured by pendant drop with a Young Laplace profile fit. No oil and water interfacial tension was measured. The authors read break points in the surface tension curves rather than reporting a cmc for each mixture.

Supporting measurements

Steady shear viscosity on a Fann coaxial cylinder viscometer, fitted with power law and Herschel Bulkley models. Electrical conductivity on a Thermo Orion meter. Hydrodynamic size by dynamic light scattering on a Malvern Zetasizer. These carry the rheology conclusions; the tensiometer did not.

Instruments Mentioned

Smartphone based pendant drop tensiometer (Droplet Lab, Markham, ON, Canada, as stated); our Dropometer

Surface tension of all suspensions, surfactant mixtures and pure HTAB solutions, at least 13 drops per fluid.

Fann 35A/SR 12 coaxial cylinder viscometer (Fann Instrument Company)

Steady shear viscosity and shear stress from about 1.53 to 1021.38 s^-1 at about 22 °C; source of all power law and yield stress values.

Thermo Orion 3 Star conductivity meter (Thermo Fisher Scientific)

Electrical conductivity of each mixture; used to find conductivity break points.

Malvern Zetasizer Nano ZS90

Hydrodynamic size of dilute nanocrystal and fumed silica suspensions by dynamic light scattering at 25 °C.

Hamilton 1750 TPLT gastight syringe, 500 µL

Dispensed the pendant drop through a 1.8 mm stainless steel needle using a screw driven plunger.

Role of the Droplet Lab instrument

The surface tension data in this paper came from a Droplet Lab smartphone based pendant drop tensiometer, the instrument we sell as the Dropometer. The paper does not use the Dropometer name.

For every suspension and surfactant level, a drop hung from a 1.8 mm steel needle, was photographed with the phone camera, and fitted to the Young Laplace equation. Each fluid was measured at least 13 times and averaged.

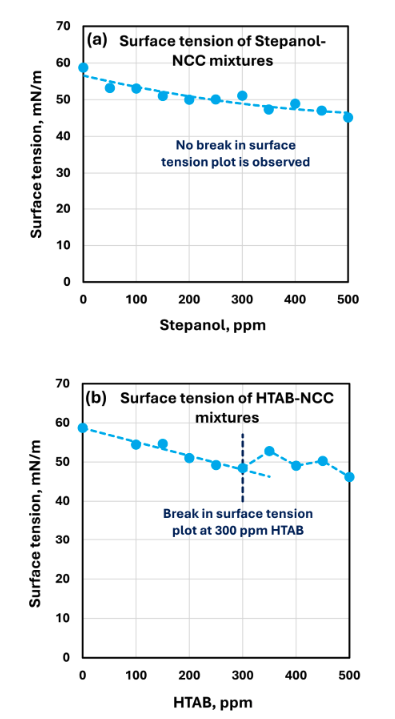
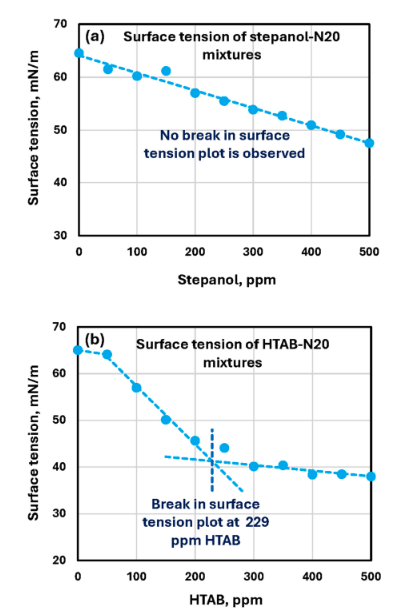
Those curves gave the break points the authors used: about 300 ppm HTAB in 1 wt% nanocrystals, 229 ppm in 2 wt% fumed silica and 352 ppm in 5 wt% fumed silica. Stepanol curves fell steadily with no break.

The tensiometer did not measure viscosity, yield stress or conductivity. Rheology was measured on a separate Fann coaxial cylinder viscometer, and the 20 to 70 fold thickening comes from that instrument.

Surface tension was one of two independent checks, with conductivity, that the sharp viscosity change began near the same HTAB dose. It supports the interpretation but does not by itself prove the network mechanism, which the authors call speculative.

Bring This Measurement Into Your Lab

If you need to find where a surfactant starts to change your suspension, a pendant drop surface tension series is a quick place to start. See how the Dropometer handles this measurement.

Method Snapshot

Droplet Lab measurement protocol

Parameter Value as reported
Instrument Smartphone based pendant drop tensiometer, Droplet Lab, Markham, ON, Canada
Method Pendant drop, image of a hanging drop analysed by drop shape software
Fit / model Young-Laplace equation fitted to the drop profile
Needle Stainless steel, 1.8 mm diameter
Syringe Hamilton 500 µL gastight, Model 1750 TPLT, screw driven plunger
Liquids Suspensions and surfactant mixtures as prepared; pure HTAB solutions
Drop volume not stated in the paper
Temperature Room temperature (preparation at 22 ± 1 °C)
Replicates At least 13 per fluid; mean reported
Timing / drop age not stated in the paper
Surfactant range 0 to 500 ppm in 50 ppm steps (11 levels)

Key Findings

Surface tension breaks track particle loading

With HTAB, surface tension breaks appeared near 300 ppm in 1 wt% nanocrystals, 229 ppm in 2 wt% fumed silica and 352 ppm in 5 wt% fumed silica, all measured on the Droplet Lab tensiometer.

No break with the anionic surfactant

Stepanol lowered surface tension steadily in every suspension with no break point, and conductivity rose linearly. Viscosity barely changed, consistent with like charges repelling.

Lab cmc for pure HTAB

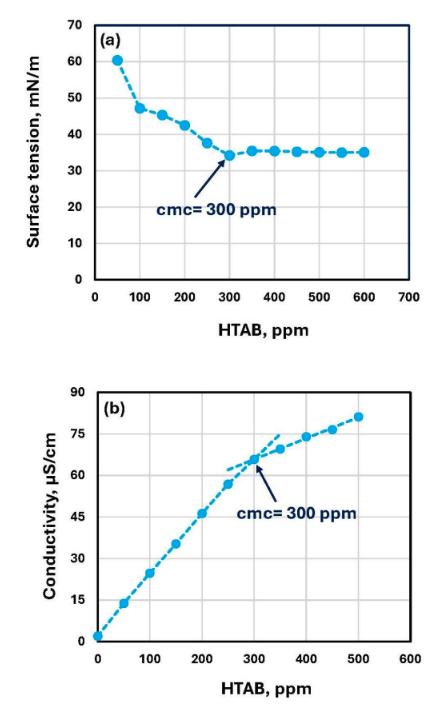
Surface tension and conductivity of pure HTAB solutions gave a cmc of 300 ppm, against a literature value of 0.91 mM, about 332 ppm.

Repeatability example

Thirteen drops of 2 wt% fumed silica with 400 ppm Stepanol read 50.26 to 54.82 mN/m, mean 50.97 mN/m, standard deviation 1.18 mN/m.

Viscometer: HTAB thickens sharply

On the separate viscometer, HTAB raised the nanocrystal consistency index from 96.3 to 1790.8 mPa·s^n at 450 ppm, with a fitted yield stress of about 2 Pa at 500 ppm.

Measured Values by Sample

Break points the authors read from their plots; the surface tension column is the Droplet Lab data, the other columns came from other instruments.

HTAB break points by suspension

System Surface tension break (Droplet Lab tensiometer) Conductivity break (conductivity meter) Sharp viscosity change (Fann viscometer)
Pure HTAB in water cmc 300 ppm (with conductivity) cmc 300 ppm (with surface tension) not measured
1 wt% nanocrystals + HTAB about 300 ppm 350 ppm above about 300 ppm
2 wt% fumed silica + HTAB about 229 ppm 197 ppm rises from 250 ppm, peaks at 300 ppm
5 wt% fumed silica + HTAB about 352 ppm 356 ppm above 350 ppm, levels off above 450 ppm
Any suspension + Stepanol no break observed no break observed no clear trend

Tabulated surface tension readings

Sample Value
2 wt% fumed silica + 400 ppm Stepanol, 13 drops 50.47, 54.82, 50.40, 50.56, 50.70, 50.67, 50.97, 50.26, 51.07, 50.64, 50.86, 50.51, 50.72 mN/m
Mean and standard deviation 50.973 mN/m; 1.177 mN/m
All other surface tension values plotted only (Figures 18, 19, 32, 34); not tabulated in the text

Figures & Visuals

Four figures plot surface tension measured with the Droplet Lab tensiometer, and Figure 4 shows the instrument itself. The paper is open access under CC BY; credit Pal, Richards and Pal, Nanomaterials 2026.

Figure 18: Pure HTAB surface tension and conductivity

Panel (a) shows surface tension of pure HTAB solutions with a cmc of 300 ppm, Droplet Lab data; panel (b) is conductivity from a separate meter. CC BY, credit Pal, Richards and Pal, Nanomaterials 2026.

Figure 19: Surface tension of nanocrystal mixtures

Surface tension of 1 wt% nanocrystals with Stepanol (no break) and HTAB (break near 300 ppm), Droplet Lab data. CC BY, credit Pal, Richards and Pal, Nanomaterials 2026.

Figures 32 and 34: Surface tension of fumed silica mixtures

Surface tension of 2 wt% (Figure 32, HTAB break near 229 ppm) and 5 wt% (Figure 34, break near 352 ppm) fumed silica mixtures, Droplet Lab data. CC BY, credit Pal, Richards and Pal, Nanomaterials 2026.

Why It Matters

Formulators thicken liquids with nanocrystals or fumed silica and add surfactants for stability and surface activity. This study shows a surface tension curve can flag the dose where a cationic surfactant starts to change flow.

An early marker

A break in surface tension marked the same dose range where viscosity jumped on the viscometer, so a quick pendant drop series can narrow down where to run full rheology.

Particles move the break

The HTAB break moved from about 229 ppm to 352 ppm as fumed silica rose from 2 to 5 wt%, so a cmc measured in water alone may not predict the break in a filled formulation.

Charge matters more than dose

The like charged anionic surfactant left both surface tension trends and viscosity without a break across the same 0 to 500 ppm range.

Same Waterloo rheology group as other Droplet Lab citations

Surface tension used alongside conductivity, not alone

Low surfactant range, 0 to 500 ppm

Open access, CC BY

Expert Perspective

Expert Perspective

The critical micelle concentration is not a number you look up; it is where the surface-tension curve flattens, and the only honest way to know it is to measure it.

Dr Alidad Amirfazli

Professor, Department of Mechanical Engineering, York University, Co-founder and Scientific Advisor, Droplet Lab

Practical Takeaways

Measure in the real matrix

Run the surface tension series in the filled suspension, not just the surfactant in water, because particles adsorb surfactant and shift the break.

Use small, even steps

Steps of 50 ppm were fine enough to place breaks within a few tens of ppm of the conductivity breaks.

Repeat and check outliers

The authors averaged at least 13 drops; their example set shows one high reading, which is why repeats matter.

FAQ

Frequently Asked Questions

Did the Dropometer measure the viscosity or rheology in this study?

No. All viscosity, power law and yield stress values came from a Fann 35A coaxial cylinder viscometer. The Droplet Lab tensiometer measured only surface tension by pendant drop.

Does the paper report a CMC or interfacial tension?

It reports a cmc of 300 ppm for pure HTAB in water from surface tension and conductivity. For the suspensions it reports break points rather than a cmc. No oil and water interfacial tension was measured.

What surface tension values does the paper give?

Only one set is tabulated: 13 readings for 2 wt% fumed silica with 400 ppm Stepanol, averaging 50.97 mN/m. All other surface tension results appear as plots against surfactant concentration.

Why did Stepanol show no break?

The authors link it to weak interaction, since Stepanol and both particles are negatively charged. Conductivity and viscosity also showed no break with Stepanol.

Citation

Use the formal reference below when citing the original paper.

Formal Reference

Pal, R., Richards, J., & Pal, A. (2026). Rheology of cellulose nanocrystal and fumed silica suspensions: Influence of ionic surfactants. Nanomaterials, 16(11), 676. https://doi.org/10.3390/nano16110676

Short Cite + DOI

Pal et al., Nanomaterials 2026, 16, 676. DOI: 10.3390/nano16110676