Contents

Client Citation Analysis

Zein Protein Nanoparticles: Fabrication and Rheology of Their Dispersions in Polysaccharides

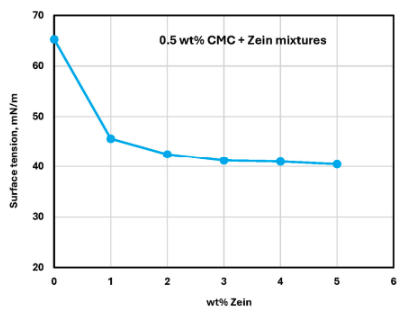
Can corn protein nanoparticles formed inside food thickeners change both flow and surface behaviour? Siyi Li and Rajinder Pal at the University of Waterloo made zein nanoparticles in carboxymethyl cellulose (CMC) and xanthan gum (XG), measured flow with coaxial cylinder viscometers, and used a Droplet Lab smartphone based pendant drop tensiometer (Dropometer) for air/liquid surface tension. Adding zein lowered surface tension sharply in both polysaccharides, and the values levelled off beyond about 3 wt% zein.

At-a-Glance Summary

Primary surface measurement reported

Equilibrium air/liquid surface tension in mN/m, from at least 15 pendant drops per sample, each drop left 1 to 3 min before imaging and fitted with the Young-Laplace equation.

Research question

How do polysaccharide type and concentration, and zein concentration, change the steady shear flow and surface activity of zein nanoparticles made in CMC or XG by antisolvent precipitation?

Headline finding

Zein nanoparticles made both thickeners far more surface active, while their effect on flow depended on the polysaccharide: CMC dispersions thickened, whereas XG dispersions mostly thinned and phase separated above 4 wt% zein.

Paper Details

Authors
Siyi Li and Rajinder Pal
Affiliation
Department of Chemical Engineering, University of Waterloo, Waterloo, ON, Canada
Journal
Foods (MDPI), Special Issue: Functional Properties of Proteins, Polysaccharides, and Their Complex Coacervates
Year
2026 (received 6 September, accepted 30 September, published 2 October 2026)
Volume
15
Issue / Article
Issue 19 (publisher page; not printed in the text) / Article 3529
Licence
Creative Commons Attribution (CC BY), as stated in the paper; version number not stated in the text, check publisher page
Pendant drop surface tension plus steady shear rheology, SEM, DLS and zeta potential
Measurement scope
Methods used
  • Surface tension: Droplet Lab smartphone based pendant drop tensiometer (Dropometer)
  • Steady shear flow curves: Fann and Haake coaxial cylinder viscometers, fitted with the power law model
  • Particle morphology: Hitachi SU8700 SEM on freeze dried samples
  • Particle size (exploratory) and zeta potential: one dispersion only, 0.6 wt% CMC with zein
CMC and XG, each with and without zein
Samples tested
Two experimental series per polysaccharide
  • Series I: 1 wt% zein with CMC or XG from 0 to 1 wt%, plus pure polysaccharide controls
  • Series II: 0.5 wt% CMC or XG with zein from 0 to 5 wt%
  • XG systems adjusted to pH 4.0; CMC systems not pH adjusted
  • One preparation per formulation; repeats are repeated measurements on that preparation
Aqueous polysaccharide solutions and zein nanoparticle dispersions, measured against air
Liquids and conditions
Test liquids
  • Zein added from a 10 wt% stock in 90% (w/w) aqueous ethanol; ethanol evaporated overnight
  • Final bulk pH about 6 to 7 (CMC systems) and about 4 (XG systems), estimated with indicator strips
  • All surface tension and rheology measurements at room temperature (value not stated)

Classification

This paper sits where food hydrocolloid rheology meets surface tension of protein nanoparticle dispersions.

What Was Measured

Primary surface / interfacial measurement

Air/liquid surface tension of pure CMC and XG solutions and of zein nanoparticle dispersions in each, measured by pendant drop on the Droplet Lab tensiometer and fitted with the Young-Laplace equation. Results are plotted in Figures 11, 13, 25 and 26.

Supporting measurements

Fann and Haake coaxial cylinder viscometers gave steady shear viscosity, fitted to power law consistency (K) and flow index (n). A Hitachi SU8700 SEM imaged freeze dried particles. DLS and a Zetasizer gave exploratory size and a zeta potential of −55.8 ± 1.5 mV for one CMC dispersion. Photos showed phase separation.

Instruments Mentioned

Dropometer (Droplet Lab, Markham, ON, as stated in the paper)

Pendant drop air/liquid surface tension of all polysaccharide solutions and zein dispersions; the paper calls it a smartphone based pendant drop tensiometer supplied by Droplet Lab.

Hamilton 500 µL gastight syringe (Model 1750 TPLT) with 1.8 mm stainless steel needle

Formed the pendant drops for the Droplet Lab measurement.

Fann coaxial cylinder viscometer (Fann Instrument Company)

Steady shear viscosity, 12 speeds from 0.9 to 600 rpm.

Haake coaxial cylinder viscometer, MV I bob (Thermo Fisher Scientific)

Steady shear viscosity, 30 speeds from 0.01 to 512 rpm.

Hitachi SU8700 scanning electron microscope

Morphology and approximate size of zein nanoparticles in freeze dried samples.

DLS and Zetasizer (model not stated)

Exploratory Z average size (about 2006 ± 80 nm, flagged by the software) and zeta potential (−55.8 ± 1.5 mV) for the 0.6 wt% CMC with zein dispersion only.

Role of the Droplet Lab instrument

The Dropometer, which the paper describes as a smartphone based pendant drop tensiometer supplied by Droplet Lab, produced every surface tension value in the study. Drops hung from a 1.8 mm stainless steel needle on a 500 µL Hamilton gastight syringe and rested about 1 to 3 min before a smartphone image was taken.

The software fitted each drop profile with the Young-Laplace equation. The authors cite the 2017 smartphone pendant drop method paper by Chen, Amirfazli and coworkers for this approach. Each sample was measured at least 15 times on one preparation and averaged, all at room temperature.

These readings showed that pure CMC is not surface active, that pure XG lowers surface tension as it is added, and that 1 wt% zein lowers surface tension substantially in both. In the zein series at 0.5 wt% polysaccharide, surface tension fell sharply up to 1 wt% zein and then levelled off beyond 3 wt%.

The Dropometer did not measure flow behaviour, particle size, particle shape, charge or pH. The idea that zein particles crowd the surface, and the identity of the adsorbing species, are the authors' interpretations; they note that dynamic surface tension and interfacial rheology would be needed to confirm them.

The surface tension data supplied the surface activity half of the paper's conclusions and underpin its suggestion that zein dispersions could serve as plant based emulsifiers or foam stabilizers. The authors also used the polysaccharide only control values as supporting evidence that residual ethanol was negligible.

Bring This Measurement Into Your Lab

If you need to see where a protein or particle dispersion lowers surface tension, you can run the same pendant drop series in your own lab with the Dropometer.

Method Snapshot

Droplet Lab measurement protocol

Parameter Value as reported
Instrument Smartphone based pendant drop tensiometer supplied by Droplet Lab, Markham, ON (Dropometer)
Method Pendant drop, air/liquid surface tension
Needle Stainless steel, 1.8 mm diameter (inner or outer not stated)
Syringe Hamilton 500 µL gastight, Model 1750 TPLT
Drop volume Not stated in the paper
Drop age before image About 1 to 3 min
Imaging Smartphone camera, high resolution image
Analysis Droplet Lab software, Young-Laplace fit of the drop profile
Replicates At least 15 measurements per sample, averaged; one preparation per formulation
Temperature Room temperature (value not stated)
Error bars or spread Not stated in the text

Samples measured and surface tension trend reported

Sample series Trend reported in the text (values plotted only)
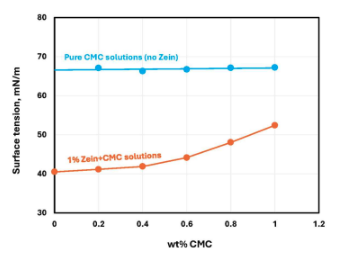
Pure CMC, 0.2 to 1 wt% (Fig. 11) Constant, independent of CMC concentration
1 wt% zein with CMC, 0 to 1 wt% (Fig. 11) Substantially lower than pure CMC; rises as CMC increases
0.5 wt% CMC with zein, 0 to 5 wt% (Fig. 13) Sharp drop from 0 to 1 wt% zein, slow decline, levels off beyond 3 wt%
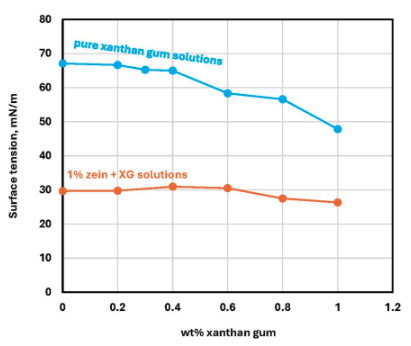
Pure XG, 0.2 to 1 wt% (Fig. 25) Decreases as XG concentration increases
1 wt% zein with XG, 0 to 1 wt% (Fig. 25) Substantially lower than pure XG; flat up to 0.6 wt% XG, then decreases
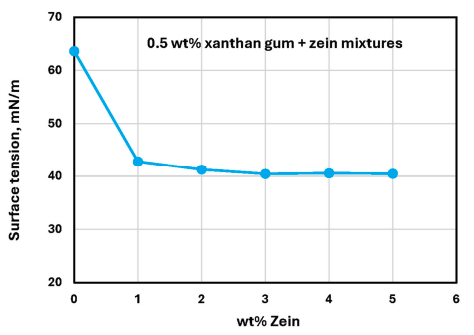
0.5 wt% XG with zein, 0 to 5 wt% (Fig. 26) Sharp drop from 0 to 1 wt% zein, slow decline, levels off beyond 3 wt%

Key Findings

Zein makes both thickeners surface active

Adding 1 wt% zein nanoparticles lowered the Dropometer surface tension of CMC and XG solutions substantially compared with the pure polysaccharides (Figures 11 and 25).

Surface tension levels off beyond 3 wt% zein

At 0.5 wt% CMC or XG, surface tension fell sharply from 0 to 1 wt% zein, then slowly, and levelled off beyond 3 wt%, which the authors link to a saturated surface (Figures 13 and 26).

CMC and XG differ on their own

Pure CMC gave a constant surface tension from 0.2 to 1 wt%, so it is not surface active, while pure XG lowered surface tension as its concentration rose.

More polysaccharide changes the zein effect

With 1 wt% zein, surface tension rose as CMC increased, which the authors attribute to particles held in the thicker bulk. In XG it stayed flat up to 0.6 wt% and then fell.

Flow results came from viscometers

Fann and Haake viscometers showed power law, shear thinning flow. Zein raised CMC consistency up to 4 wt% then dropped it, and lowered XG consistency, with phase separation above 4 wt% zein.

Figures & Visuals

Four figures in the paper contain Dropometer surface tension data. The article is open access under a Creative Commons Attribution (CC BY) licence as stated in the paper; the version number is not printed in the text, so confirm it on the publisher page before reuse.

Figure 11: Surface tension versus CMC concentration

Compares pure CMC solutions with 1 wt% zein in CMC, all measured with the Droplet Lab pendant drop tensiometer. Credit: Li and Pal, Foods 2026, 15, 3529, CC BY (version not stated in the text).

Figure 13: Surface tension versus zein in 0.5 wt% CMC

Shows the sharp drop up to 1 wt% zein and the plateau beyond 3 wt%, from Dropometer measurements. Credit: Li and Pal, Foods 2026, 15, 3529, CC BY (version not stated in the text).

Figure 25: Surface tension versus XG concentration

Compares pure XG solutions with 1 wt% zein in XG, all measured with the Droplet Lab pendant drop tensiometer. Credit: Li and Pal, Foods 2026, 15, 3529, CC BY (version not stated in the text).

Figure 26: Surface tension versus zein in 0.5 wt% XG

Shows the same sharp drop and plateau beyond 3 wt% zein as the CMC series, from Dropometer measurements. Credit: Li and Pal, Foods 2026, 15, 3529, CC BY (version not stated in the text).

Why It Matters

Food formulators want plant proteins that both thicken and stabilize interfaces. This study shows that the same zein particles can lower surface tension strongly while their effect on viscosity depends on the thickener chosen.

Plant based emulsifiers and foams

The authors suggest the drop in surface tension makes zein dispersions candidates for egg free mayonnaise or aerated desserts, which still needs emulsion and foam testing.

Choice of thickener matters

CMC and XG responded differently to zein in flow, and XG dispersions phase separated above 4 wt% zein, so surface data alone cannot pick a formulation.

Saturation point is measurable

Tracking surface tension against zein content showed where extra protein stops changing the surface, which can help when choosing a protein dose.

Zein lowers surface tension in both CMC and XG

Plateau beyond about 3 wt% zein

Pure CMC is not surface active; pure XG is

At 0.5 wt% polysaccharide, zein thickened CMC but thinned XG

Expert Perspective

Expert Perspective

Plot surface tension against surfactant concentration and the interface tells you when it is saturated — the curve bends at the point where the surface can hold no more.

Dr Alidad Amirfazli

Professor, Department of Mechanical Engineering, York University, Co-founder and Scientific Advisor, Droplet Lab

Practical Takeaways

Measure the controls

Pure polysaccharide solutions gave the baseline that showed the zein effect and helped the authors argue that leftover ethanol was negligible.

Control drop age for protein systems

The study let each drop rest about 1 to 3 min. Proteins keep adsorbing over time, so a fixed and reported drop age makes values comparable.

Plan for batch replicates

Each formulation was one preparation measured many times, which shows measurement repeatability but not batch to batch variation.

FAQ

Frequently Asked Questions

What did the Droplet Lab instrument measure in this paper?

It measured air/liquid surface tension by pendant drop for pure CMC and XG solutions and for zein nanoparticle dispersions in each. Viscosity, particle size, particle shape and charge came from other instruments.

How were the pendant drops made and analysed?

Drops hung from a 1.8 mm stainless steel needle on a 500 µL Hamilton gastight syringe and rested about 1 to 3 min. A smartphone image was fitted with the Young-Laplace equation, and at least 15 drops were averaged per sample at room temperature.

Why did surface tension stop falling beyond 3 wt% zein?

The authors attribute the plateau to a surface saturated with zein derived species. They state that the exact species (intact particles, free protein or protein and polysaccharide complexes) was not established and that dynamic surface tension would be needed.

Does the paper give numeric surface tension values?

No values are written in the text. The results appear only as plotted points in Figures 11, 13, 25 and 26, so readers should consult the figures in the open access article.

Citation

Use the formal reference below when citing the original paper.

Formal Reference

Li, S., & Pal, R. (2026). Zein protein nanoparticles: Fabrication and rheology of their dispersions in polysaccharides. Foods, 15(19), 3529. https://doi.org/10.3390/foods15193529

Short Cite + DOI

Li and Pal, Foods 2026, 15, 3529. DOI: 10.3390/foods15193529