Contents

Farming & Agriscience Industry
The Practical Guide to Surface Science (2026)

?s=100&d=m
Written by
No biography added yet.
Read More
?s=100&d=m
Reviewed by
N/A
No biography added yet.
Read More
?s=100&d=m
Written By

No biography added yet.

?s=100&d=m
Reviewed By

N/A N/A

No biography added yet.

This is a practical guide to Surface Science for researchers working in the Farming & Agriscience Industry.

In this all-new guide you’ll learn all about:

  • Crucial surface science principles
  • The significance of surface science measurements for the Farming & Agriscience industry
  • Applicable ASTM Standards & Guidelines

Let’s dive right in.

Farming & Agriscience

Executive Summary

What it covers: A practical, Farming & Agriscience–focused playbook for measuring and applying four key surface properties—contact angle, surface tension (including dynamic), surface energy, and sliding angle—to understand wetting, spreading, adhesion, and runoff on real agricultural materials and plant/soil surfaces. It connects the fundamentals to instrument methods, benchmarking data, and real-world use cases like pesticide performance, irrigation efficiency, and seed coatings.
Key insights: Real agricultural surfaces rarely have a single “true” contact angle—advancing/receding (dynamic) angles capture hysteresis and give a more reliable picture of wetting, cleanliness, roughness, and heterogeneity than a single static value. For liquids, dynamic surface tension matters whenever interfaces change quickly (droplet/bubble formation, foams, drying/evaporation), and method choice (Young–Laplace vs. polynomial fits for droplet shape; force tensiometry vs. optical methods for tension) directly impacts consistency and what you can claim for compliance.
Business value: Use surface measurements to engineer better on-leaf coverage and retention (reduced runoff, improved pest control), tune adjuvants and tank mixes for consistent spray behavior, and improve soil/seed technologies that boost moisture management and germination—raising yield while cutting chemical and water waste. The included benchmark datasets and reporting guardrails help teams spot contamination, treatment drift, and formulation variability early, before they become field failures.
Standards to follow: Follow ASTM D1331 when you must report surface/interfacial tension via Du Noüy ring or Wilhelmy plate force tensiometry, and do not label optical pendant-drop results as “ASTM D1331” without a validated bridging correlation and ongoing verification. For defensible QC and R&D, standardize and document sample prep (water quality, dilution order, equilibration time), temperature control, cleaning/conditioning, replicate statistics, and any deviations in an internal SOP aligned to the guide’s minimum reporting checklist.
Bottom line: This guide shows how to select and run the right surface measurements—and interpret them correctly—to optimize agricultural formulations and surfaces for wetting, adhesion, infiltration, and slip behavior in the real world. Done with the right methods and standards language, surface science becomes a fast, quantitative decision system for improving performance, sustainability, and reproducibility across agriscience workflows.

Chapter 1: Introduction

Understanding the physical and chemical properties of surfaces is crucial in agriculture. For instance, knowing how water droplets behave on plant leaves, how pesticides adhere to crops, and how efficiently irrigation systems operate can significantly impact agricultural outcomes, sustainability, and productivity.

We use the following surface properties to understand the behavior of Farming & Agriscience products and improve their quality.

Chapter 2: Contact Angle Measurement

The contact angle quantifies the wettability of a surface by representing the angle between a liquid’s surface and a solid surface.
Dropletlab Research

Sample Image taken from Droplet Lab Tensiometer.

Young – Laplace Method

Polynomial Method

Dynamic Contact Angle

Ideally, when we place a drop on a solid surface, a unique angle exists between the liquid and the solid surface. We can calculate the value of this ideal contact angle (the so-called Young’s contact angle) using Young’s equation. In practice, due to surface geometry, roughness, heterogeneity, contamination, and deformation, the contact angle value on a surface is not necessarily a single consistent value but rather falls within a range. The upper and lower limits of this range are known as the advancing and receding contact angles, respectively. The values of advancing and receding contact angles for a solid surface are highly sensitive to many parameters, such as temperature, humidity, homogeneity, and minor contamination of the surface and liquid. For example, the advancing and receding contact angles of a surface can differ at different locations.

Dynamic Contact Angle versus Static Contact Angle

Practical surfaces and coatings naturally show contact angle hysteresis, indicating a range of equilibrium values. When we measure static contact angles, we get a single value within this range. Solely relying on static measurements poses problems, like poor repeatability and incomplete surface assessment regarding adhesion, cleanliness, roughness, and homogeneity.

In practical applications, we need to understand how easily a liquid spreads (advancing angle) and how easily it is removed (receding angle), such as in painting and cleaning. Measuring advancing and receding angles offers a holistic view of liquid-solid interaction, unlike static measurements, which yield an arbitrary value within the range.

This insight is crucial for real-world surfaces with variations, roughness, and dynamics, aiding industries like cosmetics, materials science, and biotechnology in designing effective surfaces and optimizing processes.

Learn how Contact Angle measurement is done on our Tensiometer

For a more complete understanding of Contact Angle measurement, read our Contact Angle measurement: The Definitive Guide

Open Benchmark Data: Contact Angle & Surface Energy

These reference measurements show how deionized water wets four standard substrates measured with the Droplet Lab Dropometer. Use them as visual and numerical benchmarks when you're checking your own sample preparation, treatments, and chemistry.

Full contact angle and surface energy datasets (including additional liquids and statistics) are available on our dataset hub.

Glass - DI Water
Glass - DI Water
Nylon - DI Water
Nylon - DI Water
PMMA - DI Water
PMMA - DI Water
Teflon - DI Water
Teflon - DI Water

The droplet images above are taken from the same benchmark series as our open dataset. For each substrate and probe liquid we report:

● Advancing and receding contact angles (and hysteresis)
● Derived surface energy (SFE) values based on multi-liquid measurements
● Measurement conditions, uncertainties, and sample preparation details

Comparing your own droplet shapes and angles against these references is a fast way to spot contamination, treatment drift, or unexpected changes in wettability.

Chapter 3: Surface Tension Measurement

This property measures the force that acts on the surface of a liquid, aiming to minimize its surface area.

Surface Tension Measurement

Sample Image taken from Droplet Lab Tensiometer

Dynamic Surface Tension

Dynamic surface tension differs from static surface tension, which refers to the surface energy per unit area (or force acting per unit length along the edge of a liquid surface).

Static surface tension characterizes the equilibrium state of the liquid interface, while dynamic surface tension accounts for the kinetics of changes at the interface. These changes could involve the presence of surfactants, additives, or variations in temperature, pressure, and composition at the interface.

When to use Dynamic Surface Tension Measurement

Dynamic surface tension is essential for processes that involve rapid changes at the liquid-gas or liquid-liquid interface, such as droplet and bubble formation, coalescence (change in surface area), the behavior of foams, and the drying of paints (change in composition, e.g., evaporation of solvent). It is measured by analyzing the shape of a hanging droplet over time.

Dynamic surface tension applies to various industries, including cosmetics, coatings, pharmaceuticals, paint, food and beverage, and industrial processes, where understanding and controlling the behavior of liquid interfaces is essential for product quality and process efficiency.

Learn how Surface Tension measurement is done on our Tensiometer

For a more complete understanding of Surface Energy measurement, read our Surface Tension measurement: The Definitive Guide

Chapter 4: Surface Energy Measurement

Surface energy refers to the energy required to create a unit area of a new surface.
231

Sample Image taken from Droplet Lab Tensiometer

Learn how Surface Energy measurement is done on our Tensiometer

For a more complete understanding of Surface Energy measurement, read our Surface Energy measurement: The Definitive Guide

For benchmark contact angle and surface energy values on glass, nylon, PMMA, and Teflon, see the Open Benchmark Data panel above or visit our Dataset Hub for full CSV downloads.

Chapter 5: Sliding Angle Measurement

The sliding angle measures the angle at which a liquid film slides over a solid surface. It is commonly employed to assess the slip resistance of a surface.

sliding angle 1

Sample Image taken from Droplet Lab Tensiometer

Learn how Sliding Angle measurement is done on our Tensiometer

For a more complete understanding of Sliding Angle measurement, read our Sliding Angle Measurement: The Definitive Guide

Chapter 6: Real-World Applications

Within the Farming & Agriscience industry, several case studies exemplify the advantages of conducting surface property measurements.

Forestry & Agriscience: Using water contact angle to quantify functional surface recovery in refoliated quaking aspen after LDD moth defoliation

The paper investigates a severe mid-summer defoliation event (Ontario, Canada, 2021) where quaking aspen trees were completely stripped of leaves by LDD moth caterpillars, then refoliated within the same year. The regrown leaves were smaller, but still exhibited strong non-wetting behavior. The authors attribute the high water contact angles to a hierarchical “dual-scale” leaf surface: nanoscale epicuticular wax (ECW) crystals superimposed on microscale papillae, consistent with a Cassie–Baxter non-wetting state. Differences between refoliated vs. typical-season leaf surface morphology are discussed in relation to environmental growth conditions (notably seasonal temperature during development after budbreak).

Role of Droplet Lab Goniometer

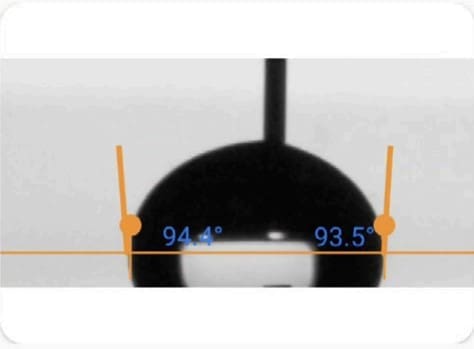
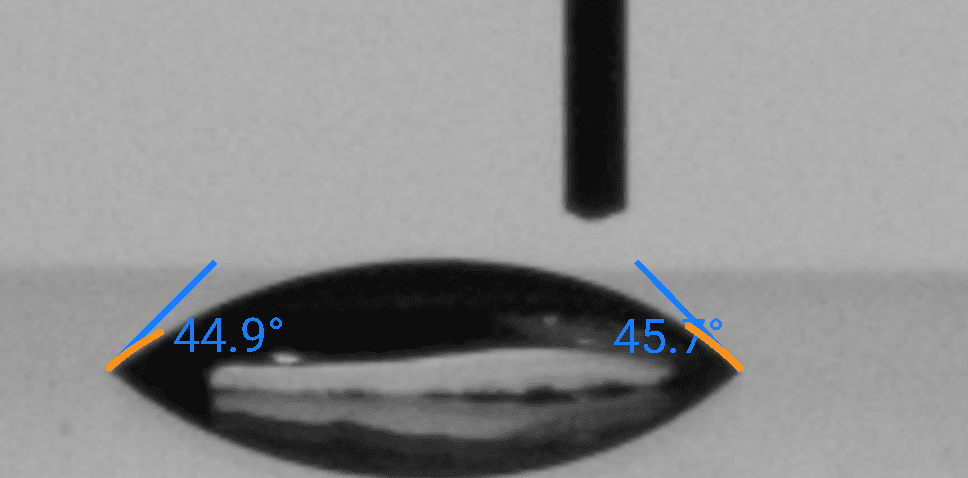
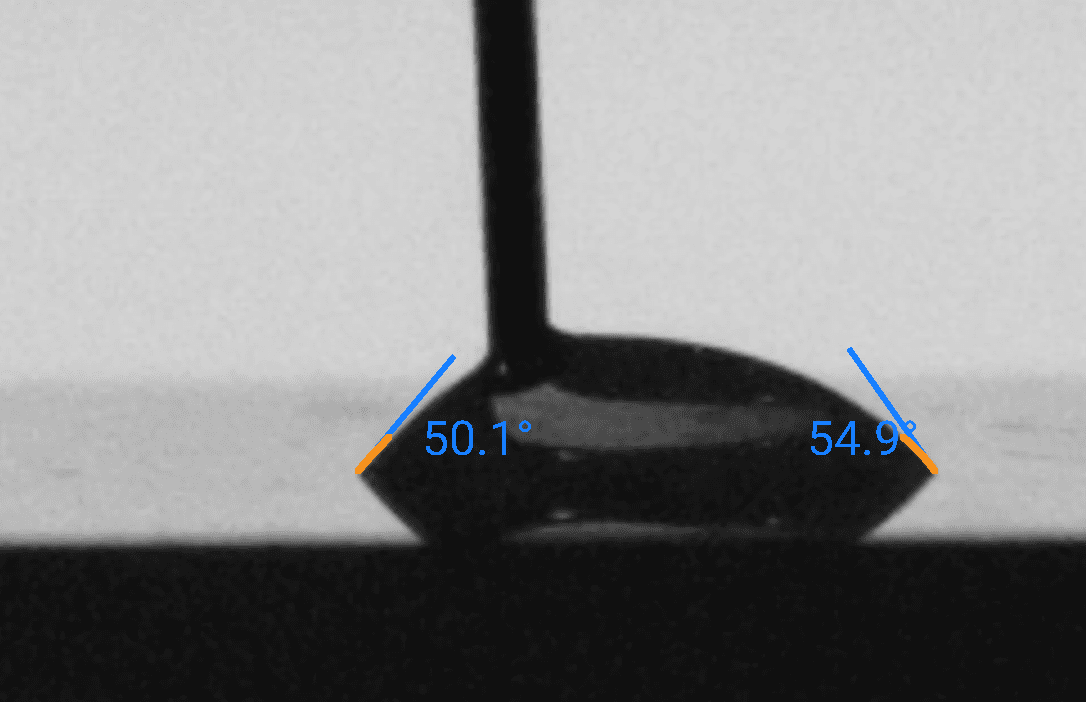
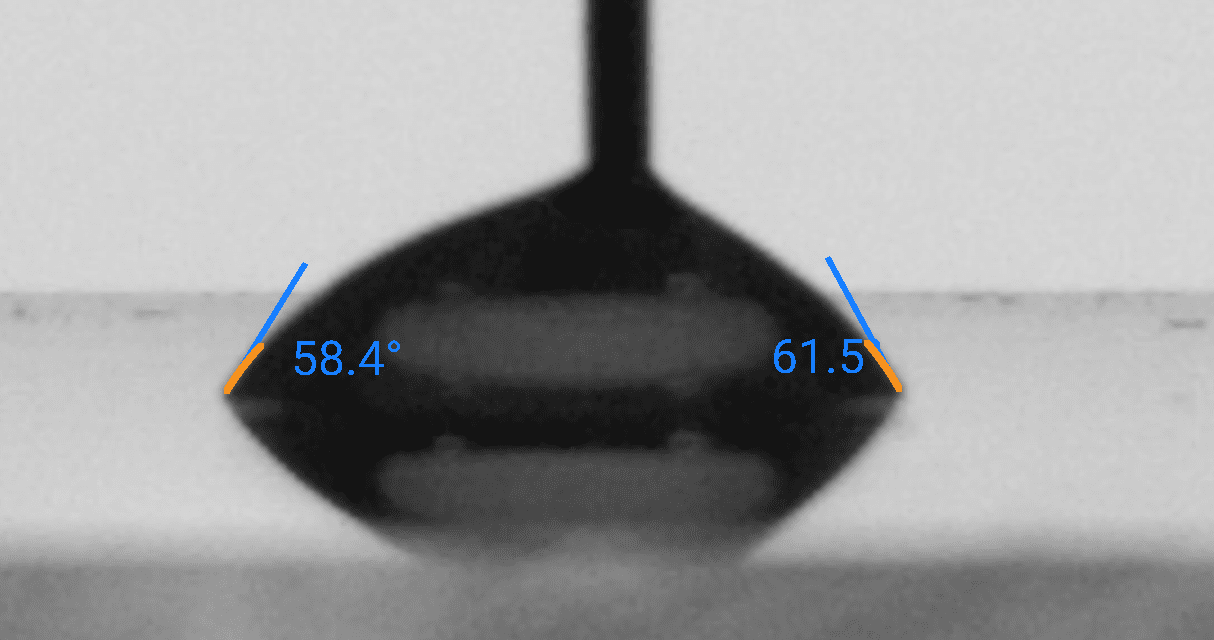
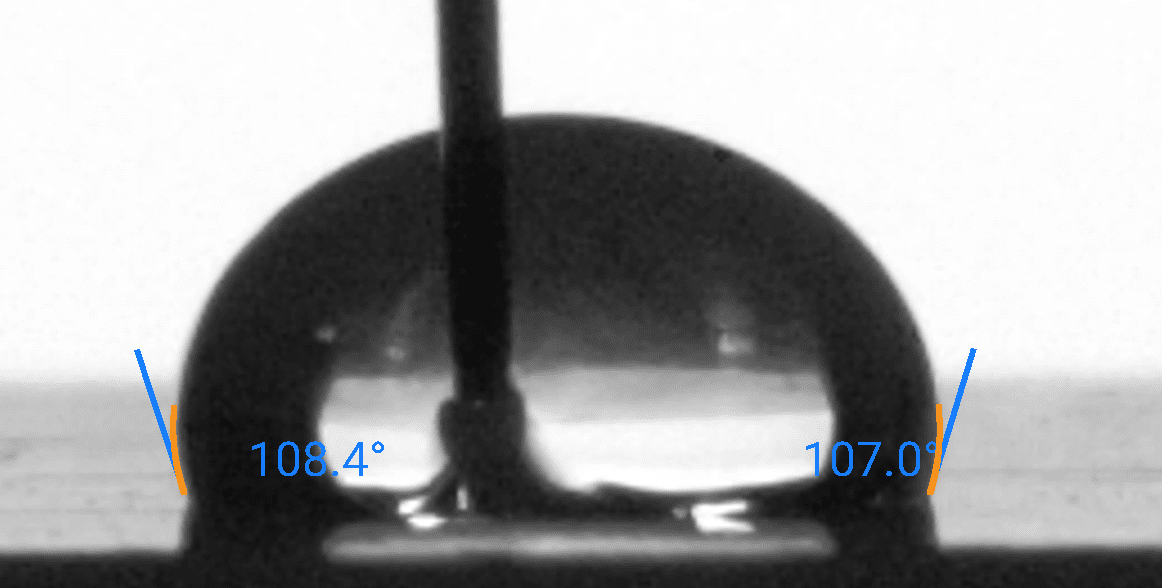
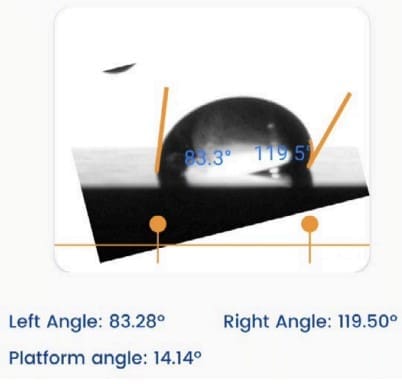
The Droplet Lab Dropometer was used to quantify the wettability recovery of refoliated aspen leaves by measuring water contact angle (WCA) on the adaxial (upper) leaf surface during the regrowth period. Specifically:

  • In Section 2.3 (“Wetting characteristics”), the study describes WCA measurements performed with the Droplet Lab Dropometer using 10 µL deionized water droplets, with ≥9 measurements per sampling date and reporting mean ± standard deviation.
  • These WCA measurements provided the primary functional metric linking:
    (1) refoliation timing and leaf development, to
    (2) micro/nano surface morphology (SEM), and to
    (3) the onset and persistence of a superhydrophobic/non-wetting state.

Where contact angle is explicitly described in the paper:

  • Methods: Section 2.3 (Droplet Lab Dropometer, 10 µL DI water, replicate counts)

Results: Section 3.2, plus Fig. 2–4 and Table 1 (WCA values/trends and correlation to surface structures)

Key Findings

  • Same-season recovery is possible: Quaking aspen in the study could refoliate in the same year after complete LDD defoliation, though with smaller leaves than typical spring growth.
  • High hydrophobicity appears quickly: Refoliated leaves were already strongly hydrophobic within ~2 days after budbreak, rather than requiring a long “ramp-up” period.
  • Measured WCA range during refoliation: Reported average WCAs across the refoliation study window were approximately ~140° to ~150° (with date-to-date variation reported as mean ± SD). (See Section 3.2, Fig. 2–4, and Table 1.)
  • Mechanism confirmed by structure + WCA: SEM showed a dual-scale hierarchy (microscale papillae + nanoscale ECW crystals) consistent with a Cassie–Baxter non-wetting state, aligning with the high WCA measurements.
  • Ultra-low adhesion prevented roll-off testing: The team notes they could not accurately measure roll-off angle because droplets rolled off immediately with slight disturbance (stated in Section 2.3).
  • Environmental conditions likely tune morphology: The refoliated leaves showed subtle morphology differences versus normal-season leaves, plausibly linked to temperature during growth after budbreak.

Why It Matters

For forestry, tree health monitoring, and agriscience, this paper shows that contact angle can serve as a fast, quantitative “functional recovery” metric after insect-driven defoliation events. In practical terms, pairing WCA with microscopy allows researchers and land managers to distinguish between “leaf return” and return of critical surface function (water shedding/non-wetting), which can influence canopy water interception, surface cleanliness/pathogen interactions, and broader ecohydrology behaviors discussed by the authors.

Method Snapshot

  • Sample: Refoliated quaking aspen (Populus tremuloides) leaves collected repeatedly during July–Aug 2021 after complete defoliation.
  • Droplet: 10 µL deionized water dispensed on the adaxial leaf surface.
  • Angle type: Static water contact angle (WCA) (advancing/receding not reported).
  • Temperature: Not explicitly specified for the contact angle test conditions (study provides outdoor weather context for growth conditions).
  • Surface tension: Not measured/reported (DI water used as the probe liquid).

Data Note

Comparison of average WCAs (with standard deviations) on the adaxial surface of quaking aspen leaves from the refoliation period in 2021 (current study, July 18th -August 26th, 2021) and from the same period in a year for a normal growth season (July 18th – September 1st, 2012) (Tranquada and Erb, 2014). Averages are based on at least 9 contact angle measurements per leaf collection date. 

Figure

Citation (APA Format)

Sui, X., Tam, J., Keller, H., Liang, W., & Erb, U. (2023). Superhydrophobicity mechanism of refoliated quaking aspen leaves after complete defoliation by LDD (gypsy, spongy) moth caterpillars. Plant Science, 330, 111659. https://doi.org/10.1016/j.plantsci.2023.111659

View Publication →

Pesticide Adhesion

Challenge: Uneven pesticide distribution can lead to pest infestations and diseases in agriculture.

Importance of Contact Angle: Proper contact angles in pesticide formulations ensure balanced coverage on plant surfaces.

Solution: A farm tested various pesticide formulations with different contact angles. They found that formulations with a contact angle close to zero adhered better to plant leaves, reducing pesticide runoff and enhancing pest control, which led to healthier crops.

Pesticide Adhesion

Pest Control

Challenge: Pesticide droplets need to spread evenly on plant surfaces to maximize effectiveness.

Importance of Surface Tension: Optimized surface tension in pesticide formulations ensures uniform coverage.

Solution: Researchers developed a new pesticide formulation with low surface tension. This formulation produced finer droplets that spread more uniformly on plant leaves, improving pest control and reducing pesticide usage.

Pest Control

Soil Moisture Management

Challenge: Maintaining soil moisture is critical for crop health.

Importance of Surface Energy: Modifying soil with the right surface energy can improve moisture retention.

Solution: Researchers created a soil amendment to optimize surface energy. This improved the soil's water-holding capacity, reduced the need for frequent irrigation, and enhanced crop resilience during droughts.

Soil Moisture Management

Seed Germination

Challenge: Inefficient seed germination can reduce crop yields.

Importance of Contact Angle: Seed coatings with specific contact angles can enhance germination by controlling water absorption and retention.

Solution: Researchers analyzed the contact angles of different seed coatings and found that hydrophilic coatings (contact angles <90°) promoted better germination by accelerating imbibition and active metabolism phases. This improved water and air availability in drought-prone regions, boosting crop yields.

Seed Germination

Drip Irrigation Efficiency

Challenge: Uneven water distribution in drip irrigation systems can cause water wastage and inconsistent crop growth.

Importance of Surface Tension: Controlling the surface tension of irrigation water droplets is crucial for uniform delivery.

Solution: A research team found that surfactants adsorbed onto hydrophobic soil particles, reducing water surface tension and improving infiltration. A farm added surfactants to their irrigation water, which led to more consistent droplet sizes and better water distribution, enhancing crop yields and conserving water.

Drip Irrigation Efficiency

We are your partners in solving your Business & Technological challenges

If you are interested in implementing these or any other applications, please contact us.

Chapter 7: Standards and Guidelines

In an industry where precision reigns supreme, how can Farming & Agriscience manufacturers ensure their products withstand scrutiny? The answer lies in standards and guidelines: the compass that guides them through the complex maze of quality and performance.

ASTM D1331 — Surface & Interfacial Tension of Solutions (Du Noüy Ring / Wilhelmy Plate Force Methods)

What it is

ASTM D1331 is a method-defined standard for measuring surface tension and interfacial tension of liquid materials using force tensiometry, where a Du Noüy ring or Wilhelmy plate is pulled from a liquid or across a liquid–liquid interface. Results should only be labeled “ASTM D1331” when produced using these ring/plate force methods (optical pendant-drop methods are not D1331 as-written).

When to use it

Formulation QC and supplier/customer specs for agrochemicals/adjuvants

Use when a product spec, COA language, or dispute-resolution test requires a ring/plate surface or interfacial tension value reported as ASTM D1331 (e.g., spray adjuvants, EC/ME concentrates, tank-mix additives).

R&D screening tied to spray performance and emulsion behavior

Use when optimizing wetting/spreading on leaves, coverage, compatibility, and emulsification (water/oil) where tension is a sensitive indicator of surfactant package changes or contamination.

In-scope / Out-of-scope

In scope
  • Surface tension of agriculture-relevant liquids (e.g., adjuvant concentrates, surfactant solutions, pesticide dilutions, fertilizer solutions, spray tank mixes) measured by Du Noüy ring or Wilhelmy plate.
  • Interfacial tension for systems with two liquid phases (e.g., water/oil or water/solvent) to support emulsion design, compatibility, and phase-separation troubleshooting.
  • Batch-to-batch trending when temperature, sample handling, and ring/plate cleanliness are controlled and documented.
  • Comparative studies across surfactant packages (nonionic/anionic, organosilicone, etc.) using consistent geometry and procedures.
Out of scope
  • Optical pendant-drop (Young–Laplace) measurements (e.g., Dropometer pendant drop) and other non-force optical methods—these are not ASTM D1331 compliant as-written.
  • Dynamic surface tension at short timescales relevant to spray atomization (may require other methods if you need milliseconds-to-seconds behavior).
  • Highly particulate, dirty, or solid-laden samples (e.g., suspensions/SCs, some biological slurries) where ring/plate wetting/contamination makes results unreliable without a validated sample-prep approach.
  • Leaf contact angle/retention on plant surfaces (use contact-angle/leaf-wetting protocols; D1331 measures liquid tension, not surface wetting on solids).

Minimum you must report (checklist)

  • Sample identity (product/formulation name, lot/batch; dilution rate and water quality if a tank-mix simulation is used—hardness, pH, ions).
  • Property measured (surface tension or interfacial tension; for interfacial, clearly identify both phases and their preparation).
  • Instrument + geometry (Du Noüy ring or Wilhelmy plate; material and relevant dimensions).
  • Temperature and equilibration time (setpoint/measured temperature; time since mixing/dilution—critical for surfactants).
  • Sample preparation and handling (mixing method, degassing/settling, filtration if used; bubble/foam controls).
  • Cleaning/conditioning protocol for ring/plate and vessels (including how you verify cleanliness with a reference check).
  • Replicates and statistics (n, mean/median, SD/IQR; outlier/rejection rule).
  • Any deviations from ASTM D1331 or your internal SOP (and why).

Note: Dropometer (optical pendant-drop Young–Laplace) can be a strong internal screening/trending tool for spray-mixture drift and contamination, but it must not be reported as “ASTM D1331” because it does not use ring/plate force tensiometry. If you want D1331-equivalent decision gates from a faster method, build and maintain a documented method-bridging correlation to a D1331 ring/plate reference.

How to interpret results (guardrails)

  • Method-specific means method-specific: do not assume pendant-drop γ equals D1331 γ without a validated correlation and ongoing verification.
  • Tie interpretation to the use case: lower surface/interfacial tension often supports wetting/emulsification, but real spray outcomes also depend on viscosity, formulation elasticity, droplet size distribution, and plant surface chemistry—validate against field/bench performance tests.
  • Use variability as a warning signal: rising scatter or unstable readings often indicate contamination (oils/silicones), foam/bubbles, poor cleaning, or phase instability—fix the cause before making formulation decisions.
  • Standardize “tank-mix realism”: if you’re testing diluted sprays, lock down water source/condition (hardness, pH), dilution order, and wait time, or you’ll measure process variation instead of formulation change.

Now It’s Your Turn

We hope this guide showed you how to apply surface science in the Farming & Agriscience industry.

Now we’d like to turn it over to you: 

Feel free to leave a comment below—we’d love to hear from you.

Leave a Reply

Your email address will not be published. Required fields are marked *


Download Experiment