Contents

Automotive Industry
The Practical Guide to Surface Science (2026)

?s=100&d=m
Written by
No biography added yet.
Read More
?s=100&d=m
Reviewed by
N/A
No biography added yet.
Read More
?s=100&d=m
Written By

No biography added yet.

?s=100&d=m
Reviewed By

N/A N/A

No biography added yet.

This is a practical guide to Surface Science for researchers working in the Automotive Industry.

In this all-new guide you’ll learn all about:

  • Crucial surface science principles
  • The significance of surface science measurements for the Automotive industry
  • Applicable ASTM Standards & Guidelines

Let’s dive right in.

Future of Automotive Manufacturing

Executive Summary

What it covers: A practical surface-science guide for the automotive industry explaining how to measure and use contact angle, surface tension (including dynamic), surface energy, and sliding/roll-off angle to evaluate coatings, treatments, and surface quality. It connects fundamentals to manufacturing use-cases (paint performance, rain-repellent windshields) and closes with a standards-and-reporting workflow.
Key insights: Real automotive surfaces rarely have a single “true” contact angle—roughness, contamination, and heterogeneity create hysteresis—so advancing/receding angles, hysteresis (Δθ), and sliding angle give a more reliable picture than one static value. Method choice matters: Young–Laplace is typically more consistent but assumes an axisymmetric drop, while polynomial fitting can handle non-axisymmetry at the cost of greater sensitivity to local imperfections; dynamic surface tension is essential when interfaces change quickly (droplet/bubble formation, foams, paint drying).
Business value: Improves decision-making on paints, sealants, and protective coatings by quantifying wettability, adhesion risk, and droplet mobility—reducing defects, rework, and performance drift. Enables faster root-cause triage and stronger process/supplier control by correlating surface texture + wetting metrics to functional outcomes (e.g., adhesion pass/fail, clearing performance, defect rates).
Standards to follow: Use an ISO 25178-2:2021 areal (3D) surface texture + wettability correlation workflow to distinguish “chemistry/contamination-driven” issues from “texture/roughness-driven” issues using measurable evidence. Standardize reporting with the guide’s minimum checklist (part/process state + zone mapping, ISO 25178 metrology settings and parameters, test liquid, droplet volume, static CA at a fixed timepoint, advancing/receding angles + hysteresis, sliding/roll-off angle with ramp rate, and environmental/reference controls).
Bottom line: This is a standards-aligned, shop-floor-relevant playbook that tells automotive teams what to measure, when to use dynamic vs static metrics, and how to interpret results safely (with guardrails) so surface data drives better coating performance and durability. Used well, it turns wettability and texture measurements into repeatable QC signals and process limits that map to real-world performance—not just lab numbers.

Chapter 1: Introduction

We analyze and improve the performance of automotive products by leveraging surface properties like surface tension and contact angles. These properties are crucial for understanding how coatings and treatments interact with vehicle surfaces, ultimately affecting the spread and adhesion of liquids on solids. Paints, sealants, and protective coatings rely heavily on these surface properties for their effectiveness and durability in the automotive industry. Automotive surface science merges precision engineering with material science to create products that not only protect and enhance vehicle surfaces but also maintain them. Striking the perfect balance between performance and appearance is paramount, ensuring that coatings can withstand environmental stressors, resist wear, and preserve the vehicle’s aesthetic appeal for years to come.

We use the following surface properties to understand the behavior of Automotive products and improve their quality.

Chapter 2: Contact Angle Measurement

The contact angle quantifies the wettability of a surface by representing the angle between a liquid’s surface and a solid surface.
Dropletlab Research

Sample Image taken from Droplet Lab Tensiometer.

Young – Laplace Method

Polynomial Method

Dynamic Contact Angle

Ideally, when we place a drop on a solid surface, a unique angle exists between the liquid and the solid surface. We can calculate the value of this ideal contact angle (the so-called Young’s contact angle) using Young’s equation. In practice, due to surface geometry, roughness, heterogeneity, contamination, and deformation, the contact angle value on a surface is not necessarily a single consistent value but rather falls within a range. The upper and lower limits of this range are known as the advancing and receding contact angles, respectively. The values of advancing and receding contact angles for a solid surface are highly sensitive to many parameters, such as temperature, humidity, homogeneity, and minor contamination of the surface and liquid. For example, the advancing and receding contact angles of a surface can differ at different locations.

Dynamic Contact Angle versus Static Contact Angle

Practical surfaces and coatings naturally show contact angle hysteresis, indicating a range of equilibrium values. When we measure static contact angles, we get a single value within this range. Solely relying on static measurements poses problems, like poor repeatability and incomplete surface assessment regarding adhesion, cleanliness, roughness, and homogeneity.

In practical applications, we need to understand how easily a liquid spreads (advancing angle) and how easily it is removed (receding angle), such as in painting and cleaning. Measuring advancing and receding angles offers a holistic view of liquid-solid interaction, unlike static measurements, which yield an arbitrary value within the range.

This insight is crucial for real-world surfaces with variations, roughness, and dynamics, aiding industries like cosmetics, materials science, and biotechnology in designing effective surfaces and optimizing processes.

Learn how Contact Angle measurement is done on our Tensiometer

For a more complete understanding of Contact Angle measurement, read our Contact Angle measurement: The Definitive Guide

Open Benchmark Data: Contact Angle & Surface Energy

These reference measurements show how deionized water wets four standard substrates measured with the Droplet Lab Dropometer. Use them as visual and numerical benchmarks when you're checking your own sample preparation, treatments, and chemistry.

Full contact angle and surface energy datasets (including additional liquids and statistics) are available on our dataset hub.

Glass - DI Water
Glass - DI Water
Nylon - DI Water
Nylon - DI Water
PMMA - DI Water
PMMA - DI Water
Teflon - DI Water
Teflon - DI Water

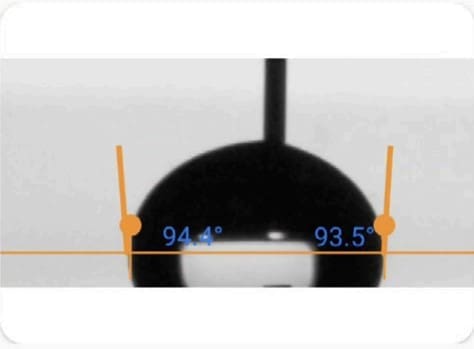
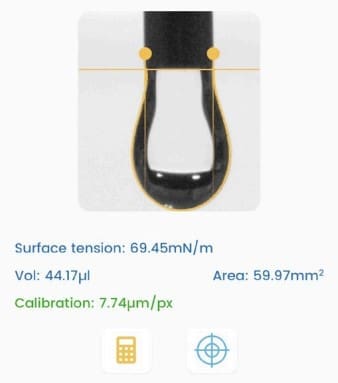
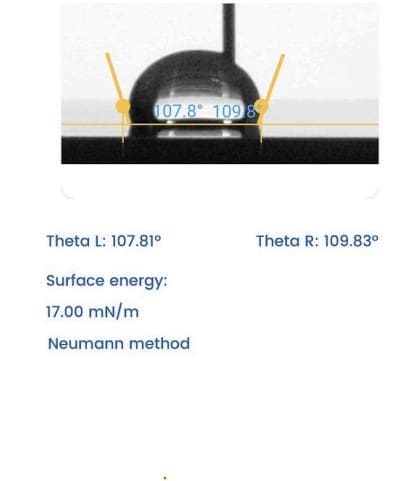
The droplet images above are taken from the same benchmark series as our open dataset. For each substrate and probe liquid we report:

● Advancing and receding contact angles (and hysteresis)
● Derived surface energy (SFE) values based on multi-liquid measurements
● Measurement conditions, uncertainties, and sample preparation details

Comparing your own droplet shapes and angles against these references is a fast way to spot contamination, treatment drift, or unexpected changes in wettability.

Chapter 3: Surface Tension Measurement

This property measures the force that acts on the surface of a liquid, aiming to minimize its surface area.

Surface Tension Measurement

Sample Image taken from Droplet Lab Tensiometer

Dynamic Surface Tension

Dynamic surface tension differs from static surface tension, which refers to the surface energy per unit area (or force acting per unit length along the edge of a liquid surface).

Static surface tension characterizes the equilibrium state of the liquid interface, while dynamic surface tension accounts for the kinetics of changes at the interface. These changes could involve the presence of surfactants, additives, or variations in temperature, pressure, and composition at the interface.

When to use Dynamic Surface Tension Measurement

Dynamic surface tension is essential for processes that involve rapid changes at the liquid-gas or liquid-liquid interface, such as droplet and bubble formation, coalescence (change in surface area), the behavior of foams, and the drying of paints (change in composition, e.g., evaporation of solvent). It is measured by analyzing the shape of a hanging droplet over time.

Dynamic surface tension applies to various industries, including cosmetics, coatings, pharmaceuticals, paint, food and beverage, and industrial processes, where understanding and controlling the behavior of liquid interfaces is essential for product quality and process efficiency.

Learn how Surface Tension measurement is done on our Tensiometer

For a more complete understanding of Surface Energy measurement, read our Surface Tension measurement: The Definitive Guide

Chapter 4: Surface Energy Measurement

Surface energy refers to the energy required to create a unit area of a new surface.
231

Sample Image taken from Droplet Lab Tensiometer

Learn how Surface Energy measurement is done on our Tensiometer

For a more complete understanding of Surface Energy measurement, read our Surface Energy measurement: The Definitive Guide

For benchmark contact angle and surface energy values on glass, nylon, PMMA, and Teflon, see the Open Benchmark Data panel above or visit our Dataset Hub for full CSV downloads.

Chapter 5: Sliding Angle Measurement

The sliding angle measures the angle at which a liquid film slides over a solid surface. It is commonly employed to assess the slip resistance of a surface.

sliding angle 1

Sample Image taken from Droplet Lab Tensiometer

Learn how Sliding Angle measurement is done on our Tensiometer

For a more complete understanding of Sliding Angle measurement, read our Sliding Angle Measurement: The Definitive Guide

Chapter 6: Real-World Applications

Within the Automotive industry, several case studies exemplify the advantages of conducting surface property measurements.

Optimizing Automotive Paint

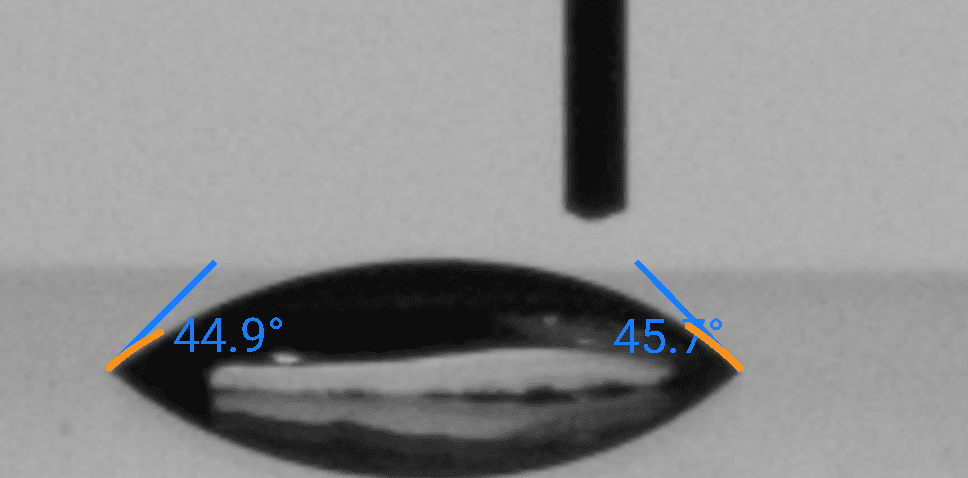
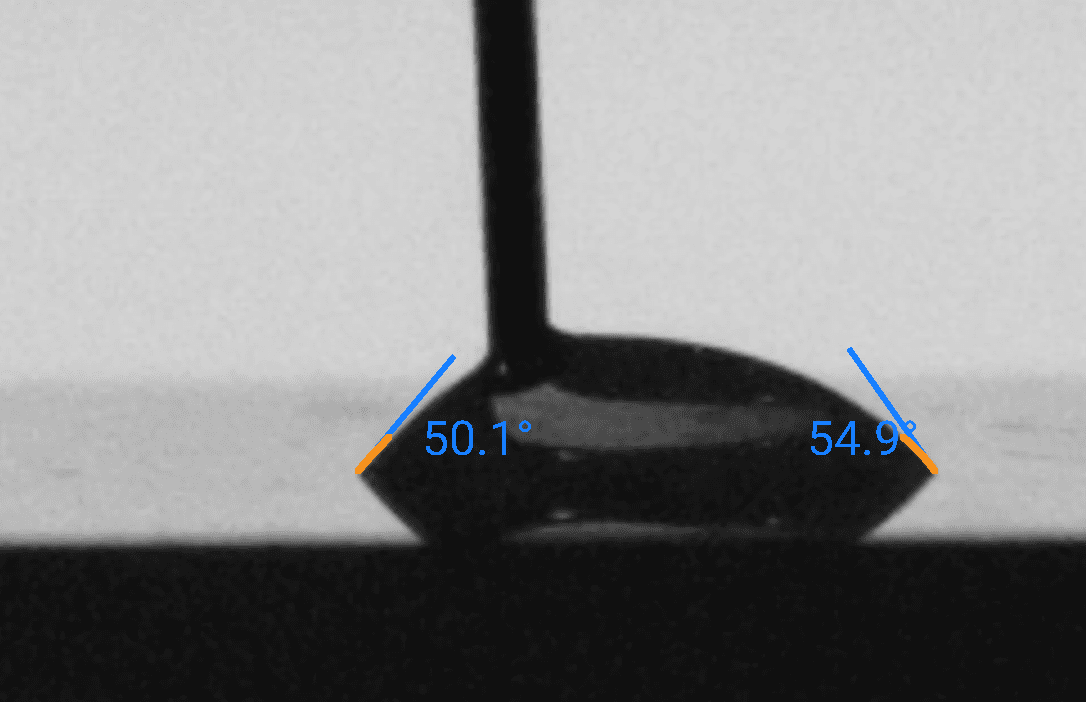
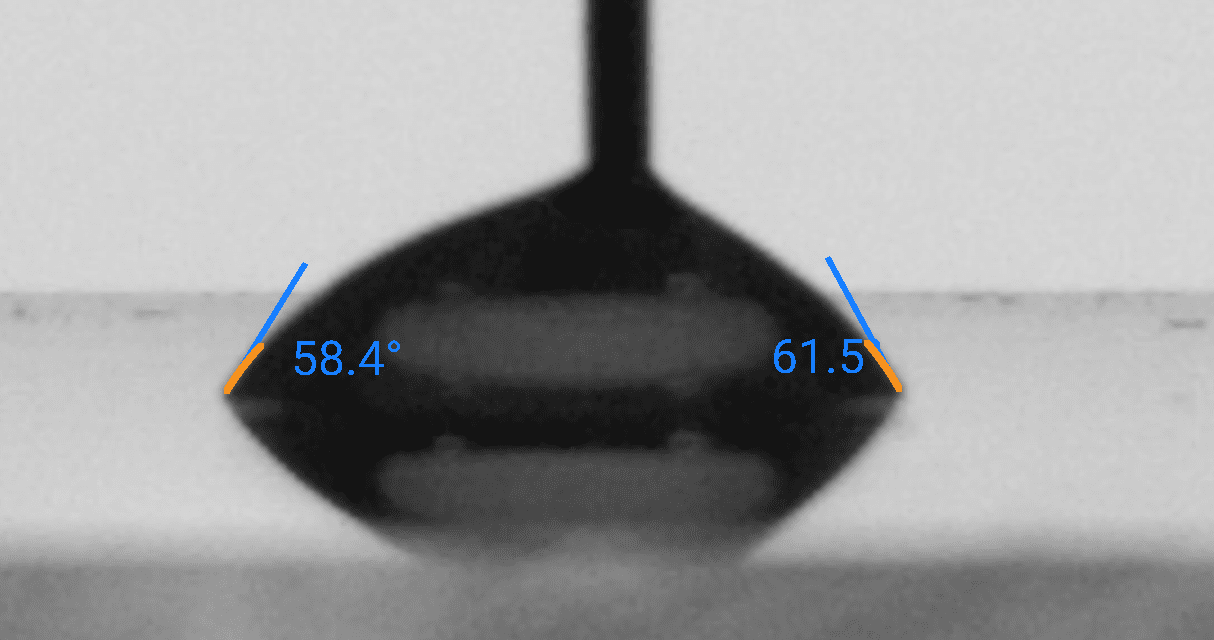
We applied four different paints (A, B, C, and D) to curved metal surfaces like car hoods and doors to identify the most water-repellent option. We used contact angle as the key measure, with a larger angle indicating better water repellency. Paint A completely absorbed water droplets, while Paint B formed a 36-degree contact angle. Paints C and D achieved even better results, with contact angles of 42 and 58 degrees, respectively. These measurements represent the average of 8 and 10 readings for paints A and B, and C and D, respectively. Based on these results, Paint D emerges as the most suitable candidate for water resistance, clearly demonstrated by its superior contact angle. Conversely, Paint A proves entirely unsuitable, allowing water to spread and potentially be absorbed due to its minimal contact angle.

Optimizing Automotive Paint

Automotive Windshields and Rain Repellency

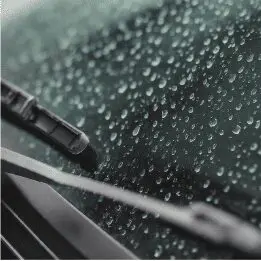
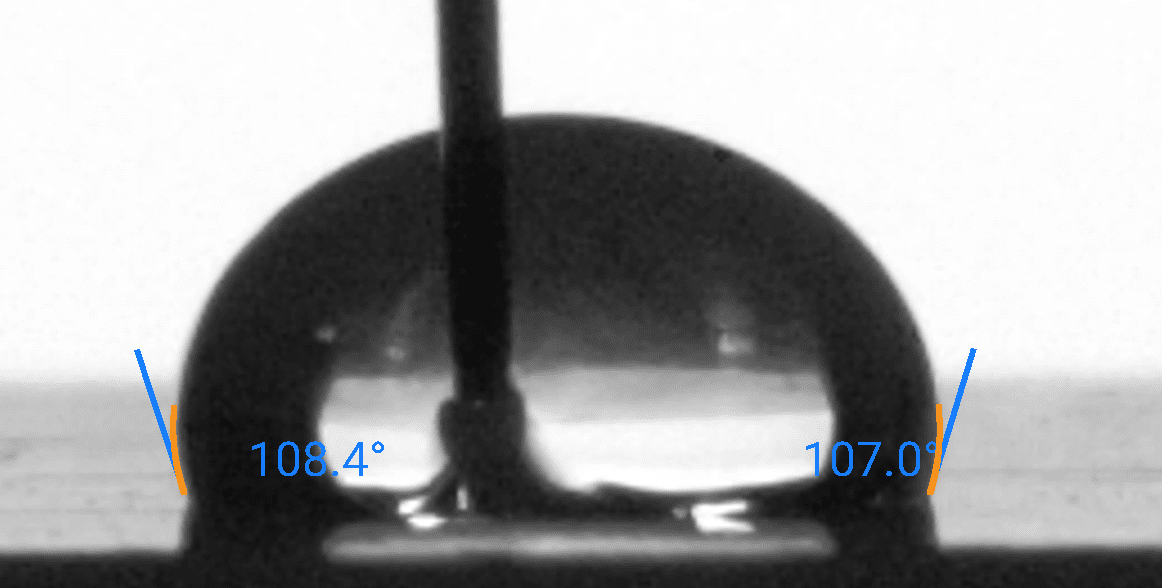
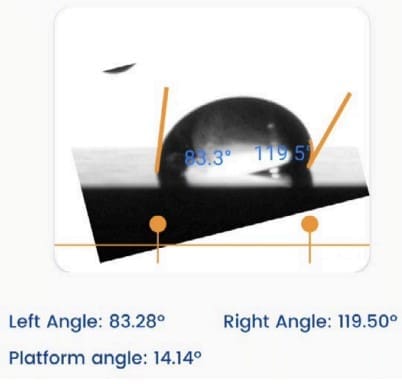
The automotive industry prioritizes maintaining clear visibility for drivers during rain to ensure safety. Traditional windshields often struggle with water build-up, compromising visibility and putting drivers at risk. To address this, the industry has developed a unique solution: applying a hydrophobic coating with a low sliding angle to automotive windshields. This low angle allows rainwater to easily slide off the surface, significantly reducing water build-up and dramatically improving driver visibility and safety in rainy conditions.

Automotive Windshields and Rain Repellency

We are your partners in solving your Business & Technological challenges

If you are interested in implementing these or any other applications, please contact us.

Chapter 7: Standards and Guidelines

In an industry where precision reigns supreme, how can Automotive manufacturers ensure their products withstand scrutiny? The answer lies in standards and guidelines: the compass that guides them through the complex maze of quality and performance.

ISO 25178-2:2021 + Wettability Correlation — Automotive Surface Texture (Dropometer companion workflow)

What it is

A combined characterization workflow that pairs ISO 25178 areal (3D) surface texture parameters with quantitative wettability and droplet-mobility metrics to explain whether functional performance is driven mainly by surface chemistry/contamination or by texture/roughness state. Dropometer provides the wettability/mobility measurements; ISO 25178 texture metrology must be performed separately using a profilometer/interferometer.

When to use it

Root-cause triage for functional failures (adhesion, water retention, coating defects, sensor clearing):

Use when a part fails or drifts and you need to separate “chemistry/contamination” causes from “texture recipe/process” causes with measurable evidence.

Qualification and supplier/process control (new coating/primer, micro-pattern, etch/blast/tool-wear changes):

Use when establishing PPAP/APQP-ready limits by correlating texture parameters + wetting/mobility outputs to real performance outcomes.

In-scope / Out-of-scope

In scope
  • ISO 25178 areal texture parameter reporting under fixed metrology settings (typical starter set: Sa, Sq, Sdq, Sdr, Str, Std).
  • Wettability + droplet mobility testing (static contact angle at a fixed timepoint, advancing/receding angles where stable, hysteresis, sliding/roll-off angle).
  • Zone-based mapping on real parts (center/edge/functional zones) with variability reporting (median + IQR).
  • Part-family correlation model linking texture + wettability outputs to an agreed functional outcome (e.g., adhesion pass/fail, clearing requirement, defect rate).
Out of scope
  • Performing ISO 25178 texture metrology with Dropometer (Dropometer does not measure 3D areal texture).
  • Claiming ISO 25178 compliance/certification or reproducing normative ISO standard text (this is a companion workflow, not a certification).
  • Universal “roughness corrections” using Wenzel/Cassie as a guarantee (model assumptions and metastability/pinning can invalidate simple corrections).
  • Liquid surface tension/surface energy determination as a substitute for functional validation unless you also apply appropriate methods and prove correlation for your process.

Minimum you must report (checklist)

  • Part/substrate identification + process state (material, coating/primer, treatment history, cleanliness/handling state) and zone map used.
  • ISO 25178 metrology settings (instrument type, measurement area, objective, sampling/resolution, filtering) and the reported parameter set (at minimum Sa/Sq + Sdr/Sdq; add Str/Std if directionality matters).
  • Test liquid (DI water or process-relevant liquid) and any critical notes (e.g., surfactants/solvents if used).
  • Droplet volume (choose one per part family, e.g., 5 µL or 10 µL) and dispense method.
  • Static contact angle at a fixed timepoint (e.g., CA @ 2.0 s ± 0.2 s), with replicate count and median + IQR per zone.
  • Advancing (θₐ) and receding (θᵣ) angles where stable, plus hysteresis Δθ = θₐ − θᵣ, including the dosing/withdrawal approach and stability rejection rules.
  • Sliding/roll-off angle (α) including tilt ramp rate, droplet volume, and pass/fail criteria for valid roll-off events.
  • Data quality + controls: environment (temperature/RH), reference/golden sample result for the run, and rejection criteria used (e.g., failed edge detection/fit QC, vibration, gross non-axisymmetry not attributable to the surface).

Note: Correlation thresholds must be calibrated per part family + process by tying texture + wettability outputs to actual functional outcomes (adhesion test, clearing/fogging performance, defect/return rates). Treat Wenzel/Cassie interpretations as diagnostic models with assumptions, not as universal truth.

How to interpret results (guardrails)

  • Chemistry/contamination-dominated drift: Wettability/mobility shifts (CA@time, Δθ, α) without meaningful change in ISO 25178 parameters; re-check handling/cleaning and confirm with a reference panel.
  • Texture-dominated drift: ISO 25178 parameters shift (often Sdr/Sdq/Str/Std), and wettability/mobility moves consistently with them; verify metrology settings are locked, then investigate texture process steps (etch/blast/patterning/tool wear).
  • Regime change (Wenzel-like ↔ Cassie-like behavior): Static CA may remain similar while Δθ and α change dramatically; treat this as a potential wetting-state shift and validate droplet size vs feature scale plus pinning/metastability controls.
  • Don’t certify “self-cleaning” from static CA alone: Use mobility (α) and hysteresis (Δθ) as primary functional indicators for clearing, and set acceptance limits from your calibrated performance data (not generic thresholds).

Now It’s Your Turn

We hope this guide showed you how to apply surface science in the Automotive industry.

Now we’d like to turn it over to you: 

Feel free to leave a comment below—we’d love to hear from you.

Leave a Reply

Your email address will not be published. Required fields are marked *


Download Experiment