Contents

Electrical & Electronics Industry
The Practical Guide to Surface Science (2026)

?s=100&d=m
Written by
No biography added yet.
Read More
?s=100&d=m
Reviewed by
N/A
No biography added yet.
Read More
?s=100&d=m
Written By

No biography added yet.

?s=100&d=m
Reviewed By

N/A N/A

No biography added yet.

This is a practical guide to Surface Science for researchers working in the Electrical & Electronics Industry.

In this all-new guide you’ll learn all about:

  • Crucial surface science principles
  • The significance of surface science measurements for the Electrical & Electronics industry
  • Applicable ASTM Standards & Guidelines

Let’s dive right in.

Electrical & Electronics

Executive Summary

What it covers: A practical, electronics-focused guide to measuring contact angle (static + dynamic), surface tension (incl. dynamic), surface energy, and sliding angle to understand wettability, adhesion, and surface “readiness” in electrical & electronic components. It also includes benchmark datasets, real-world case studies (PCBs, solar coatings, LIG electrodes), and a standards-oriented QC workflow.
Key insights: Real production surfaces show contact-angle hysteresis, so advancing/receding angles often explain adhesion/cleanliness/roughness effects better than a single static value; method choice matters (e.g., Young–Laplace is more consistent but needs axisymmetry, while polynomial fitting handles non-axisymmetric drops common on real parts). Use dynamic surface tension when interfaces change quickly (droplet formation, foams, drying), and treat WCA/SFE as trend signals that can reveal contamination and handling drift early.
Business value: Adds a fast, non-destructive way to detect surface contamination, process drift, and batch variability before they become solderability issues, coating failures, or device-to-device performance spread. Helps teams build defensible QC gates (median + variability, mapped across panels/coupons) that reduce scrap, rework, and failure-triage time.
Standards to follow: Anchor solderability programs to IPC J‑STD‑003 and use water contact angle (WCA) mapping (plus optional surface free energy trend) as a companion pre-screen that’s correlated to your chosen J‑STD‑003 method outcomes and/or downstream defect rates. Follow the guide’s minimum reporting controls—fixed droplet volume/timepoint, environment controls, mapped sampling plans, and golden/sentinel coupons, and don’t overclaim room-temperature screening as a replacement for molten-solder solderability testing.
Bottom line: A standards-aware, shop-floor-relevant playbook for turning surface measurements into actionable manufacturing decisions in electronics; what to measure, how to measure it, and how to interpret trends to prevent adhesion and wettability-driven failures. Use the benchmarks and correlation approach to move from “interesting numbers” to reliable go/no-go surface readiness signals.

Chapter 1: Introduction

Surface property measurements of various electronic and electrical systems are essential for quality control and reliability. As an example, a good adhesive and wetting behavior of a circuit is paramount to prevent the possibility of circuit failure. In electronic and electrical components, the adhesive and wetting behavior is affected by various factors that include the presence of contaminants on the boundary.  Other areas are:


Electrical & Electronics

We use the following surface properties to understand the behavior of Electrical & Electronics products and improve their quality.

Chapter 2: Contact Angle Measurement

The contact angle quantifies the wettability of a surface by representing the angle between a liquid’s surface and a solid surface.
Dropletlab Research

Sample Image taken from Droplet Lab Tensiometer.

Young – Laplace Method

Polynomial Method

Dynamic Contact Angle

Ideally, when we place a drop on a solid surface, a unique angle exists between the liquid and the solid surface. We can calculate the value of this ideal contact angle (the so-called Young’s contact angle) using Young’s equation. In practice, due to surface geometry, roughness, heterogeneity, contamination, and deformation, the contact angle value on a surface is not necessarily a single consistent value but rather falls within a range. The upper and lower limits of this range are known as the advancing and receding contact angles, respectively. The values of advancing and receding contact angles for a solid surface are highly sensitive to many parameters, such as temperature, humidity, homogeneity, and minor contamination of the surface and liquid. For example, the advancing and receding contact angles of a surface can differ at different locations.

Dynamic Contact Angle versus Static Contact Angle

Practical surfaces and coatings naturally show contact angle hysteresis, indicating a range of equilibrium values. When we measure static contact angles, we get a single value within this range. Solely relying on static measurements poses problems, like poor repeatability and incomplete surface assessment regarding adhesion, cleanliness, roughness, and homogeneity.

In practical applications, we need to understand how easily a liquid spreads (advancing angle) and how easily it is removed (receding angle), such as in painting and cleaning. Measuring advancing and receding angles offers a holistic view of liquid-solid interaction, unlike static measurements, which yield an arbitrary value within the range.

This insight is crucial for real-world surfaces with variations, roughness, and dynamics, aiding industries like cosmetics, materials science, and biotechnology in designing effective surfaces and optimizing processes.

Learn how Contact Angle measurement is done on our Tensiometer

For a more complete understanding of Contact Angle measurement, read our Contact Angle measurement: The Definitive Guide

Open Benchmark Data: Contact Angle & Surface Energy

These reference measurements show how deionized water wets four standard substrates measured with the Droplet Lab Dropometer. Use them as visual and numerical benchmarks when you're checking your own sample preparation, treatments, and chemistry.

Full contact angle and surface energy datasets (including additional liquids and statistics) are available on our dataset hub.

Glass - DI Water
Glass - DI Water
Nylon - DI Water
Nylon - DI Water
PMMA - DI Water
PMMA - DI Water
Teflon - DI Water
Teflon - DI Water

The droplet images above are taken from the same benchmark series as our open dataset. For each substrate and probe liquid we report:

● Advancing and receding contact angles (and hysteresis)
● Derived surface energy (SFE) values based on multi-liquid measurements
● Measurement conditions, uncertainties, and sample preparation details

Comparing your own droplet shapes and angles against these references is a fast way to spot contamination, treatment drift, or unexpected changes in wettability.

Chapter 3: Surface Tension Measurement

This property measures the force that acts on the surface of a liquid, aiming to minimize its surface area.

Surface Tension Measurement

Sample Image taken from Droplet Lab Tensiometer

Dynamic Surface Tension

Dynamic surface tension differs from static surface tension, which refers to the surface energy per unit area (or force acting per unit length along the edge of a liquid surface).

Static surface tension characterizes the equilibrium state of the liquid interface, while dynamic surface tension accounts for the kinetics of changes at the interface. These changes could involve the presence of surfactants, additives, or variations in temperature, pressure, and composition at the interface.

When to use Dynamic Surface Tension Measurement

Dynamic surface tension is essential for processes that involve rapid changes at the liquid-gas or liquid-liquid interface, such as droplet and bubble formation, coalescence (change in surface area), the behavior of foams, and the drying of paints (change in composition, e.g., evaporation of solvent). It is measured by analyzing the shape of a hanging droplet over time.

Dynamic surface tension applies to various industries, including cosmetics, coatings, pharmaceuticals, paint, food and beverage, and industrial processes, where understanding and controlling the behavior of liquid interfaces is essential for product quality and process efficiency.

Learn how Surface Tension measurement is done on our Tensiometer

For a more complete understanding of Surface Energy measurement, read our Surface Tension measurement: The Definitive Guide

Chapter 4: Surface Energy Measurement

Surface energy refers to the energy required to create a unit area of a new surface.
231

Sample Image taken from Droplet Lab Tensiometer

Learn how Surface Energy measurement is done on our Tensiometer

For a more complete understanding of Surface Energy measurement, read our Surface Energy measurement: The Definitive Guide

For benchmark contact angle and surface energy values on glass, nylon, PMMA, and Teflon, see the Open Benchmark Data panel above or visit our Dataset Hub for full CSV downloads.

Chapter 5: Sliding Angle Measurement

The sliding angle measures the angle at which a liquid film slides over a solid surface. It is commonly employed to assess the slip resistance of a surface.

sliding angle 1

Sample Image taken from Droplet Lab Tensiometer

Learn how Sliding Angle measurement is done on our Tensiometer

For a more complete understanding of Sliding Angle measurement, read our Sliding Angle Measurement: The Definitive Guide

Chapter 6: Real-World Applications

Within the Electrical & Electronics industry, several case studies exemplify the advantages of conducting surface property measurements.

Using Contact-Angle QC to Control Batch Variability in Laser‑Inscribed Graphene Electrodes for Printed/Flexible Electronics Sensors

The study evaluates batch-to-batch variability when manufacturing arrays of LIG electrodes on polyimide using a CO₂ laser, then characterizes the material using goniometry, stereomicroscopy, open-circuit potentiometry, and cyclic voltammetry. It reports that bare LIG can show low variability under controlled fabrication/testing conditions, but Pt metallization (nanoplatinum electrodeposition) substantially boosts electrochemical response while increasing batch variability, creating a key performance vs. manufacturability tradeoff for scaling sensor production.

Role of the Droplet Lab Goniometer

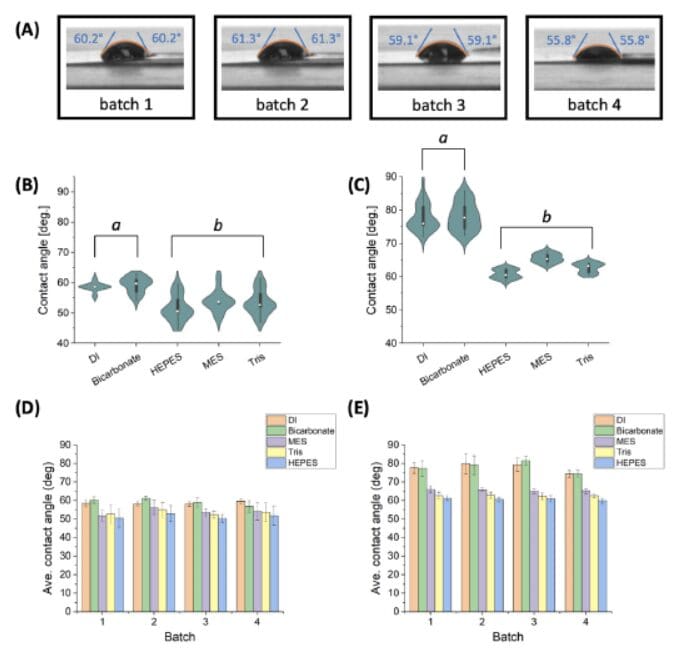
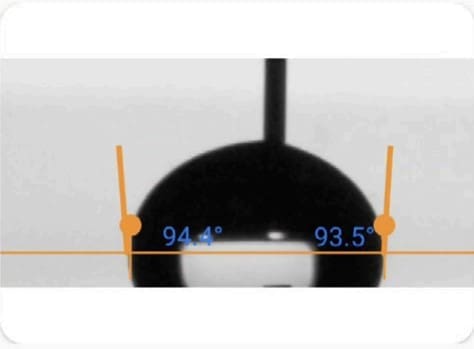
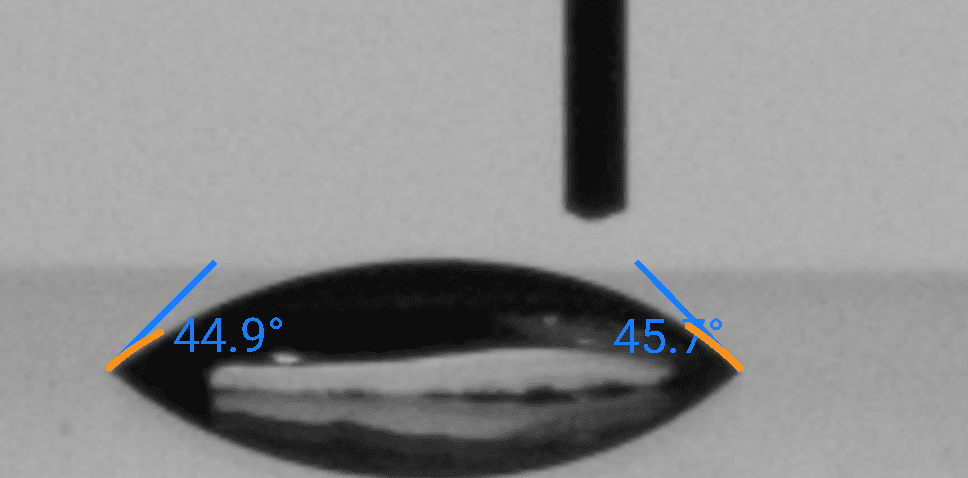
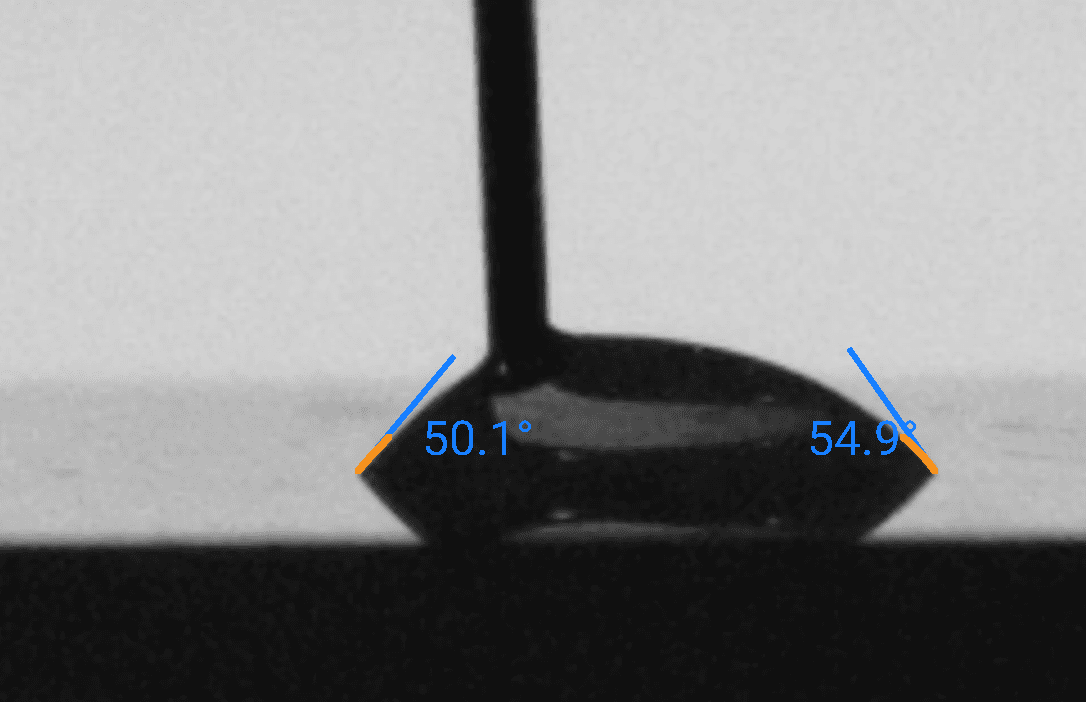
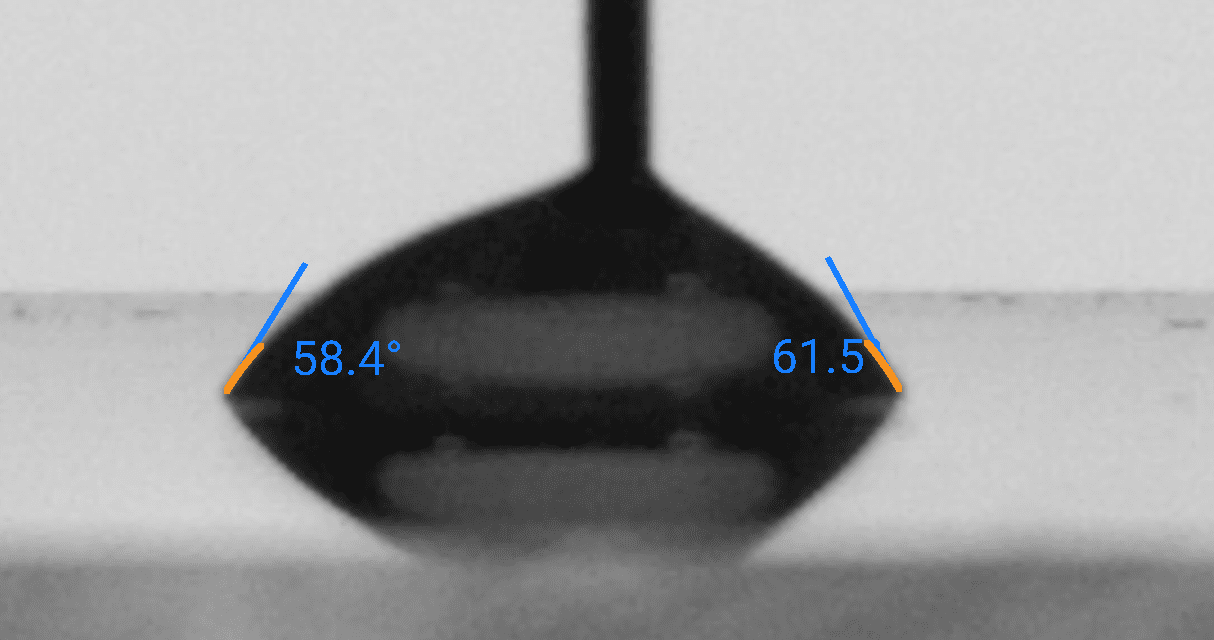
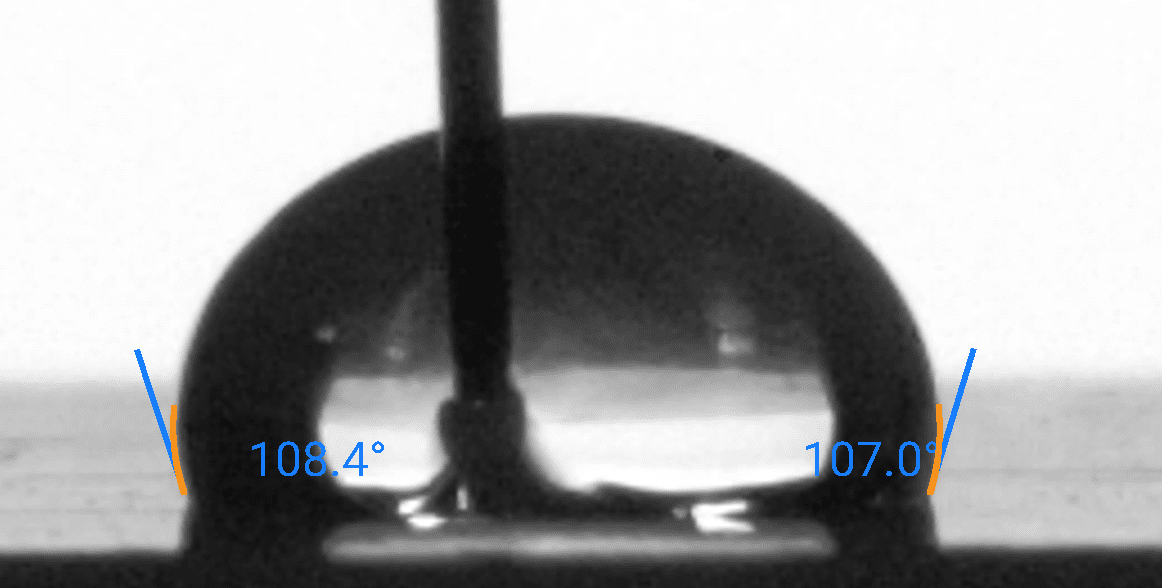
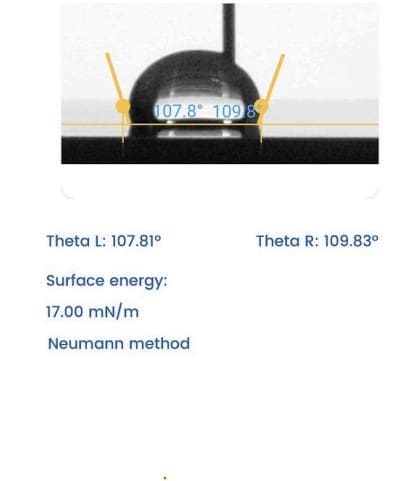
The Droplet Lab DROPOMETER‑M was used as a wettability/quality-control screen for LIG electrode surfaces by measuring static contact angle using a 2 µL sessile droplet placed on the LIG working area (Section 2.4). Because the LIG surface produced large fitting errors with axisymmetric Young–Laplace methods, the authors used a non-axisymmetric polynomial method for contact-angle calculation and archived the images (Section 2.4).

In the Electrical & Electronics context, this is significant because contact angle provides a fast, non-destructive indicator of surface state and process consistency for laser-processed carbon electrodes—helping teams detect when manufacturing conditions (e.g., long print runs, laser downtime/maintenance) begin to degrade uniformity (Section 3.1; Figure 1).

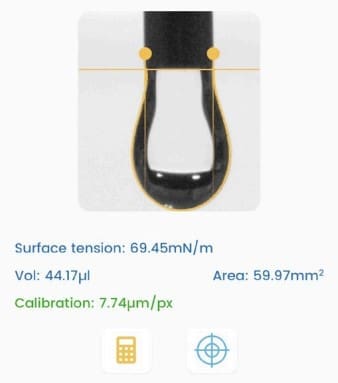
Where the paper explicitly ties wettability to liquid/surface-tension behavior:
In Section 3.1, the authors note that common buffers (HEPES, MES, Tris) lower contact angle versus DI water and interpret this as surfactant-like behavior impacting interfacial conditions; however, surface tension is not directly measured.

Key Findings

  • Bare LIG wettability is consistent under controlled batching: In DI water, LIG showed a mean contact angle of ~58.6° (hydrophilic) with <5% within-batch variation when fabricated in smaller batches (Section 3.1; Figure 1D).
  • Long production runs can break wettability consistency: A single-day run of 36 electrodes caused >30% contact-angle variation; splitting production into four batches of nine with laser downtime reduced variation to <5% (Section 3.1).
  • Electrolyte/buffer choice changes wetting behavior: HEPES, MES, and Tris reduced contact angle compared with DI, consistent with surfactant-like effects that can alter the electrode–electrolyte interface during electronics-grade sensor testing (Section 3.1; Figure 1B).
  • Metallization shifts surface wetting: After nanoplatinum deposition, contact angle increased to ~78° (more hydrophobic), indicating a meaningful surface-property change relevant to fluid handling and sensor interface design (Section 3.1; Figure 1C/E).
  • Electrochemical conditioning requirements differ by configuration: Peak oxidative current stabilized after ~4 CV scans for single LIG electrodes vs ~2 scans for the LIG sensor-chip format (Section 3.2; Figure 2).

Performance vs repeatability tradeoff is real for scaling: Pt metallization increased peak current/capacitance proxies but batch variation increased substantially (discussion around Sections 3.3–3.4; Figure 5C), emphasizing the need for QC gates before high-volume electronics production.

Why It Matters

For manufacturers scaling printed/flexible electrochemical sensors or other LIG-enabled microelectronic components, contact angle is a practical incoming/inline QC metric: it quickly flags changes in surface condition that can affect electrolyte wetting, interfacial stability, and ultimately device-to-device variability. This paper shows that process controls (batch sizing, laser downtime/maintenance) can dramatically improve wettability consistency, and that metallization methods should be selected with an explicit tradeoff mindset—balancing improved electrochemical performance against increased batch variability that complicates production specs and yields.

Method Snapshot

  • Sample: CO₂-laser-inscribed graphene electrodes on polyimide film (with and without nanoplatinum metallization).
  • Droplet / temperature / angle type: 2 µL sessile droplets at room temperature; static contact angle computed using a non-axisymmetric polynomial fit (Droplet Lab DROPOMETER‑M; Section 2.4).

Surface tension: Not directly measured; buffer-dependent wetting changes are discussed as surfactant-like effects (Section 3.1).

Data Note

Hydrophobicity study of LIG and nPt-LIG. (A) Representative images from goniometry testing of four electrode batches (LIG sample with 2 μL DI). Results of non-axisymmetric method and calculated contact angle shown on each image. Violin plots show contact angle in testing liquids for: (B) non-modified LIG electrodes, and (C) nPt-LIG electrodes. White dots represent median value, black boxes show range from the lower to the upper quartile, whiskers present the variability outside upper and lower quantile, and the shape of violin indicates the data density (n = 24 for each group). Average contact angle is shown for: (D) non-modified LIG, and (E) nPt-LIG electrodes.

Figure

Citation (APA Format)

Tang, Y., Moreira, G. A., Vanegas, D., Datta, S. P. A., & McLamore, E. S. (2024). Batch-to-batch variation in laser-inscribed graphene (LIG) electrodes for electrochemical sensing. Micromachines, 15, 874. doi:10.3390/mi15070874

View Publication →

Printed circuit boards (PCBs): Adhesion of the solder mask

Scenario: A manufacturer of printed circuit boards (PCBs) effectively employed in-field data collection to identify an issue with the adhesion of the solder mask to the PCBs.


Application: Through this data-driven approach, manufacturers can pinpoint the problem and implement a solution that significantly improves the solder mask adhesion, reducing PCB defects.

Printed circuit boards (PCBs): Adhesion of the solder mask

Solar Cell: Wettability

Scenario: In the case of a solar cell manufacturer, measuring the wettability of a new type of coating proved problematic. The coating displayed strong hydrophobic properties, making it difficult for the liquid used in the measurement to wet the surface.


Application: A specialized minimal liquid technique was employed to overcome this challenge. By capturing data directly from the manufacturing environment, businesses gain access to precise and timely information, allowing them to detect and resolve issues swiftly, ultimately leading to better product outcomes and decision-making.

Solar Cell: Wettability

We are your partners in solving your Business & Technological challenges

If you are interested in implementing these or any other applications, please contact us.

Chapter 7: Standards and Guidelines

In an industry where precision reigns supreme, how can Electrical & Electronics manufacturers ensure their products withstand scrutiny? The answer lies in standards and guidelines: the compass that guides them through the complex maze of quality and performance.

IPC J-STD-003 — Solderability Tests for Printed Boards (Wetting Balance Companion)

What it is

IPC J-STD-003 defines test methods used to assess solderability (acceptable wettability) of printed wiring board conductors/lands/PTHs, helping confirm fabrication, storage, and handling have not degraded solderability. This companion workflow adds a non-destructive, pre-solder screening layer using water contact angle (WCA) and optional surface free energy (SFE) trending to detect contamination/handling drift before destructive solderability testing or assembly builds.

When to use it

Incoming / pre-assembly pad readiness screening

Use WCA (and optional SFE trend) to flag lots/panels with elevated contamination risk before committing to destructive J-STD-003 testing or production assembly.

Failure triage when solderability or assembly defects drift

Use mapped WCA/SFE patterns (median + variability) to separate likely causes such as handling residue, storage aging, finish-process drift, or measurement artifacts.

In-scope / Out-of-scope

In scope
  • Non-destructive wettability / cleanliness trending on PCB finishes (e.g., Cu, ENIG/ENEPIG, immersion Sn/Ag) via WCA mapping at a fixed timestamp.
  • Optional SFE “trend mode” (comparative, fixed protocol) to improve discrimination when WCA alone is not sufficient.
  • Correlation (“calibration”) to your chosen J-STD-003 method outcome (e.g., wetting balance / other listed methods) or to downstream defect rates to create defensible internal gates.
  • Routine controls and drift monitoring using a known-good “golden coupon” and an intentionally aged/handled sentinel coupon.
Out of scope
  • Replacing J-STD-003 solderability tests (WCA/SFE does not generate wetting balance force–time curves or molten-solder solderability outcomes).
  • Molten solder contact-angle measurement at reflow/immersion temperatures when the instrument operating environment is limited to ≤45 °C (room-temperature screening only).
  • Universal accept/reject cutoffs for WCA/SFE (thresholds must be derived from your correlation dataset and process window).
  • Claims of assembly success or design validation based solely on WCA/SFE (surface readiness ≠ guaranteed process robustness).

Minimum you must report (checklist)

  • Standard referenced (IPC J-STD-003 revision used) and the J-STD-003 method you correlate against (e.g., wetting balance or other method used in your program).
  • Feature + finish definition (pad type/geometry, finish stack, lot/date code, time since finish, storage/packaging/handling notes).
  • Instrument + mode (WCA only, or WCA + SFE trend) and contact-angle type (static at fixed timestamp; optional advancing/receding if used).
  • Probe liquid(s) (DI water for baseline; list SFE liquid set if used) and droplet volume (fixed; small enough to remain fully on-pad).
  • Timepoint definition (e.g., WCA @ 2.0 s ± 0.2 s) and capture/fit criteria used by the software.
  • Sampling plan (number of spots, mapped locations across coupon/panel; report median + IQR or equivalent variability metric).
  • Environment (temperature/RH) and any cleaning/handling controls (gloves, no silicone wipes, time from unpack to test).
  • Controls + gates (golden coupon results per run/shift, drift sentinel, and your Green/Yellow/Red thresholds tied to correlated outcomes; include how you handle “≤10° instrument floor” reporting).

Note: Contact angle/SFE screening is a companion tool that provides a fast, localized “surface readiness” signal; it does not certify IPC compliance or replace molten-solder solderability tests. Because the instrument is limited to room-temperature operating conditions, treat any flux/spread measurements as comparative screening only, not a soldering-temperature wetting metric.

How to interpret results (guardrails)

  • Directionality, not absolutes: At a fixed timestamp, lower WCA generally indicates a cleaner, higher-energy surface (lower organic contamination risk), but only your correlation dataset makes it a QC gate.
  • Trend + variability matter: A rising median WCA and/or rising IQR (non-uniformity) is an early warning for handling residue, storage aging, or inconsistent processing across zones.
  • SFE is comparative: If you use SFE, interpret it as a controlled trend vs a reference coupon, not as an absolute material constant (keep liquid set, volume, and timepoint fixed).
  • Don’t overclaim measurement limits: If the surface fully wets below the device range, record “≤10° (instrument floor)”; reject/re-run spots with off-pad placement, poor fit/QC, or visible residue at the site.

Now It’s Your Turn

We hope this guide showed you how to apply surface science in the Electrical & Electronics industry.

Now we’d like to turn it over to you: 

Feel free to leave a comment below—we’d love to hear from you.

Leave a Reply

Your email address will not be published. Required fields are marked *


Download Experiment