15–20%
of annual revenue consumed by Cost of Poor Quality in typical manufacturing operations
American Society for Quality

Accelerate electrolyte wetting by quantifying contact angle, spreading kinetics, and surface tension on real electrode and separator materials, so you can reduce filling time, catch dry spots, and de-risk additive selection with a QC-ready gate.
Who this is for: Battery R&D chemists, lithium-ion process engineers, and QA/QC teams evaluating electrode, separator, and electrolyte formulation changes.
Positioning: Dropometer does not replace full lithium-ion battery validation (electrochemical testing, impedance, cycle life). It adds fast, quantitative wetting behavior data, contact angle, spreading kinetics, and liquid surface tension, earlier in the workflow than a full cell build, so you catch a wetting problem before it becomes a formation or impedance problem.
Droplet Lab builds precision instruments and software for surface science measurement, specialising in contact angle analysis and surface tension characterisation. Used by researchers across materials science, pharmaceuticals, coatings, and advanced manufacturing, Droplet Lab's Dropometer has contributed to studies published in peer-reviewed journals including Advanced Functional Materials (Impact Factor 19). The team combines instrument engineering with deep domain knowledge in wettability science with a focus on practical accuracy.
of annual revenue consumed by Cost of Poor Quality in typical manufacturing operations
American Society for Quality
higher hidden cost vs. visible scrap cost: rework, re-inspection, downtime, and warranty claims are rarely captured
Lean Six Sigma research consensus
upstream prevention typically saves $10 in internal rework and up to $100 in external warranty and recall costs, for the specific failure modes an upstream screen actually catches
COPQ prevention-to-failure ratio
Sources: ASQ, Learn Lean Sigma, Fabrico COPQ Guide 2026. Figures are industry-wide benchmarks, not Droplet Lab claims. On this page specifically, the relevant cost isn't factory scrap, it's electrolyte filling downtime and R&D iteration time: slow wetting extends the filling and formation step on every cell, and a wrong additive choice discovered only at cycle-life testing is a far more expensive iteration than one caught at the wetting-screen stage.
Quick technical reference for battery R&D chemists and process engineers evaluating fit before reading further.
Electrolyte wetting failures in lithium-ion cells that cause slow filling, incomplete wetting, dry regions in electrode or separator layers, and inconsistent electrolyte distribution across batches.
A fast screening and QC tool for electrolyte wetting optimization, additive evaluation, and drift detection in electrode or electrolyte batches before cell assembly. Not a replacement for full electrochemical validation (impedance, formation, cycle life).
Contact angle for electrolyte wetting on electrode and separator surfaces
Spreading and absorption kinetics (wetting rate)
Pendant drop surface tension of the liquid electrolyte
Surface energy trend data for electrode or separator materials, where relevant
Correlate wetting metrics to your own battery outcomes (wetting time, impedance, formation yield) per electrolyte system and electrode material family, not a generic published value.
Use real electrolyte or a controlled electrolyte solvent system
Fixed droplet volume, small-volume dosing supported down to the instrument's automatic dosing floor
Minimum 5 replicates per zone
Report contact angle plus kinetics plus variability, not a single reading
Porous electrode materials produce an apparent contact angle, not a true equilibrium value, since the liquid is wicking into the pore structure as it's measured. Wetting metrics are a strong predictive indicator of filling behavior, not a guarantee of downstream electrochemical performance.
The Dropometer serves four roles across an electrolyte wetting program. Each has a different primary risk.
Fighting slow electrolyte filling and formation dwell time that's limiting line throughput, and needing to know whether the bottleneck is electrolyte chemistry or electrode microstructure.
Screening candidate electrolyte additives for wetting performance before committing to full cell builds and cycle-life testing, ranking candidates by measured wetting data instead of trial cells.
Needing a numeric release gate on incoming electrode or separator batches to catch a wetting drift before it reaches cell assembly.
Requiring documented, defensible evidence of electrode, separator, and electrolyte batch qualification for NCR responses, CAPA files, or supplier audits.
This is not a universal solution. Check the conditions below before investing further time.
Poor electrolyte wetting doesn't just slow the line, it produces uneven solid electrolyte interphase formation and impedance variability that shows up much later, and much more expensively.
In lithium-ion battery production, electrolyte filling and wetting is a critical, often underappreciated step. Poor wetting leaves dry regions in the electrode or separator, increases impedance, and produces uneven formation of the solid electrolyte interphase, the layer that governs long-term cycling stability. Because these downstream effects surface during formation or cycle-life testing, a wetting problem discovered there is a far more expensive iteration than one caught at the wetting-screen stage.
Wetting behavior is driven by liquid electrolyte surface tension, electrode and separator pore structure, and additive chemistry, all measurable well before a full cell build. High electrolyte surface tension slows infiltration into the electrode's pore network; additives change surface tension, viscosity, and interfacial chemistry, sometimes in ways that trade wetting speed for electrochemical compatibility; and electrode microstructure sets a physical ceiling on how fast even an ideal electrolyte can wet the material.
This workflow measures contact angle, spreading kinetics, and pendant-drop surface tension directly on real electrode, separator, and electrolyte materials, so wetting behavior can be screened and additive candidates ranked before committing lab time to a full cell build. The honest limit: contact angle on a porous electrode is an apparent value, not a true equilibrium reading, and wetting metrics predict filling behavior, they don't replace the electrochemical testing that confirms an additive is actually compatible with the cell chemistry.
Your electrolyte doesn't wet electrode materials consistently. The wetting process varies across batches, leading to slow filling, incomplete wetting, and downstream performance variability, without a quantitative way to isolate whether the cause is the electrolyte, the electrode, or the additive package.
Why:
How to detect:
Corrective action:
Why:
How to detect:
Corrective action:
Why:
How to detect:
Corrective action:
Why:
How to detect:
Corrective action:
Why:
How to detect:
Corrective action:
Why:
How to detect:
Corrective action:
A surface science specialist can review your wetting and impedance history and help you identify whether a wetting screen would add a useful upstream gate.
Surface readiness measurement produces the type of numeric, traceable output that a subjective "the electrolyte looked like it wetted fine" observation cannot. If your quality system requires documented evidence of process control at each stage for NCR responses, CAPA files, incoming inspection records, or supplier audits, contact angle and wetting-kinetics data provide that evidence in a format your QA documentation already requires.
Numeric contact angle, wetting kinetics, and surface tension values with replicate spread, timestamps, and electrode/electrolyte lot identification; replacing subjective wetting notes with defensible numeric logs.
When an impedance or formation-yield issue triggers a Corrective and Preventive Action file, wetting data from before and after an electrolyte, electrode, or additive change provide quantitative evidence of the mechanism involved, not anecdotal description.
Non-conformance reports that include numeric wetting data allow you to assign root cause to electrolyte surface tension, electrode microstructure, additive effect, or contamination with evidence, not inference.
Incoming electrode, separator, or electrolyte lot inspection using contact angle and wetting kinetics provides a numeric acceptance criterion for supplier qualification, independent of the supplier's own published values.
Contact angle and wetting kinetics trend logs demonstrate statistical process control at the filling step; relevant to Six Sigma, SPC, and DMAIC programs targeting wetting-driven yield loss.
A concentration-series comparison across candidate electrolyte additives gives R&D a numeric basis for gating which additive advances to full cell build and cycle-life testing, instead of discovering an incompatibility only after that far more expensive step.
Why it matters: Direct indicator of how well electrolyte wets the electrode surface.
How to interpret: Lower contact angle generally indicates better wetting, correlated against your own filling-time data.
When it is not enough: On a porous electrode, this is an apparent contact angle, not a true equilibrium value.
Why it matters: Reflects real electrolyte filling behavior over time, not just a single-point reading.
How to interpret: Faster spreading and absorption indicates better real-process wetting rate.
When it is not enough: A surface-level measurement; it doesn't confirm electrolyte reaches deep pore structure uniformly.
Why it matters: A key property of the liquid electrolyte itself that influences wetting rate independent of the electrode.
How to interpret: Lower surface tension generally supports faster wetting.
When it is not enough: Doesn't account for electrode-specific interaction; pair with contact angle data on the actual electrode material.
Why it matters: Detects non-uniform wetting or contamination that a single-point reading would miss.
How to interpret: High variability relative to your baseline signals contamination, batch inconsistency, or electrode drift worth investigating.
When it is not enough: Flags inconsistency without identifying which specific root cause is responsible.
Why it matters: Detects pinning and surface heterogeneity that a static contact angle reading can miss.
How to interpret: High hysteresis between advancing and receding angle indicates surface irregularity worth flagging.
When it is not enough: A supplementary signal, most useful when a static reading looks acceptable but real-process wetting still seems inconsistent.
Independent benchmarking and publication-based validation references.
Benchmark Validation
Dropometer contact angle and pendant-drop surface tension methods have been benchmarked against KRÜSS DSA100E reference measurements. The instrument is referenced in peer-reviewed journals including Bioactive Materials (Impact Factor 20) and Advanced Functional Materials (Impact Factor 19).
See peer-reviewed validationPublication Evidence
Our instruments are referenced in peer-reviewed journals, theses, and conference publications.
Browse citationsDropometer is best used to build a wetting baseline for your electrode, separator, and electrolyte system, then screen additive candidates against it before committing to a full cell build.
Select the electrode and separator materials actually used in your lithium-ion cell: This determines which surfaces your baseline and future batches get measured against
Measure contact angle, kinetics, and surface tension on a known-good electrolyte and electrode system: This baseline is what every future batch and additive candidate gets compared to
Measure surface tension of each candidate electrolyte formulation, then contact angle and wetting kinetics on the real electrode: Compare formulation-level and real-surface wetting performance before a full cell build
Set PASS / MONITOR / FAIL thresholds based on measured wetting parameters, correlated to your own filling-time and impedance data: PASS: within baseline band → release for cell assembly MONITOR: borderline result → re-measure or hold for review FAIL: out of band → hold and troubleshoot using the Root Causes signal pattern
We completed our gage R&R study on the unit and it performed very well.
Brandon Barbee
Corporate Quality Engineer - Zeus Industries - Polymer Manufacturing
An editable SOP template your team can adapt for your electrode, separator, and electrolyte system. Includes measurement protocol, gate-setting guidance, and a QC log format ready for your documentation system.
Representative output format. Values are illustrative, not a universal specification.
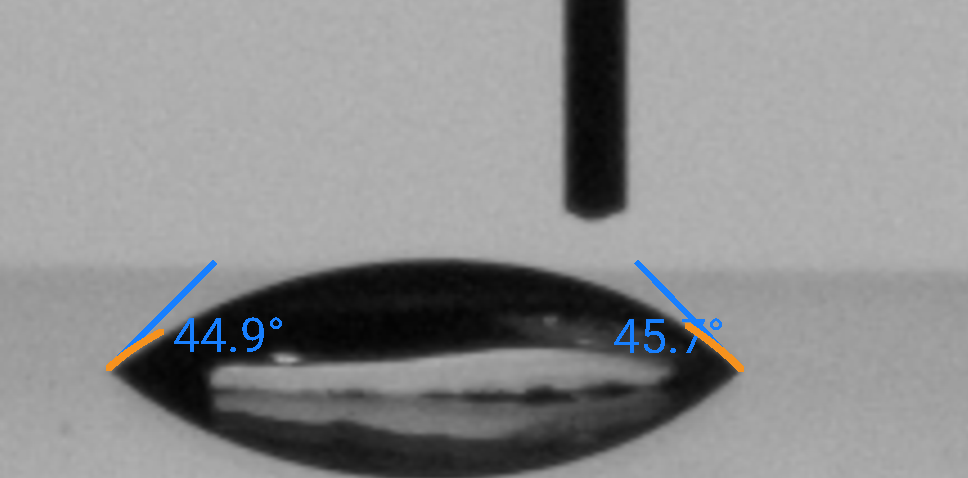
Dropometer contact angle and spreading-kinetics measurement on a real electrode surface, tracking time-to-wet across candidate electrolyte additive formulations. This is the type of output used to select an additive candidate before committing to a full cell build.
| Candidate System | Electrolyte Surface Tension (mN/m) | Contact Angle on Electrode (°) | Time to 90% Spread (s) | Additive Fit |
|---|---|---|---|---|
| Baseline electrolyte, no additive | 32.1 | 41 | 48 | Reference baseline |
| Baseline + Additive A, at target concentration | 28.6 | 22 | 19 | Faster wetting, candidate for adoption |
| Baseline + Additive B, at target concentration | 29.4 | 35 | 41 | Marginal improvement, weak candidate |
| Baseline + Additive C, at target concentration | 27.9 | 18 | 15 | Fastest wetting; confirm electrochemical compatibility before adoption |
Additive A shows a clear wetting improvement over baseline and is a reasonable candidate on wetting data alone. Additive B's surface tension drop is modest and its contact angle and spread-time improvements are marginal, likely not worth the reformulation cost relative to Additive A. Additive C shows the fastest wetting of the three but that result alone doesn't confirm electrochemical compatibility, the wetting screen narrows the candidate list, it doesn't replace impedance and cycle-life testing on whichever additive advances. This output would be included in the additive selection record used to decide which candidate proceeds to a full cell build.
Simple checklist for pre-bond release gating
Goal: Standardize electrolyte wetting evaluation for lithium-ion batteries
Start condition: filling time is inconsistent, dry regions are appearing, or impedance variability is showing up across cells. Use the signal pattern to identify the most likely cause.
Likely cause: Electrolyte surface tension has drifted upward, limiting infiltration rate.
Action: Optimize solvent composition or introduce a compatible wetting additive.
Likely cause: Electrode or separator microstructure and porosity are limiting wetting rate independent of electrolyte chemistry.
Action: Adjust electrode calendaring pressure or porosity target; treat this as a mechanical fix, not a formulation one.
Likely cause: The additive is changing surface tension, viscosity, or interfacial chemistry in a way that affects wetting, and possibly electrochemical compatibility too.
Action: Quantify the wetting effect first, then confirm electrochemical compatibility before adoption.
Likely cause: Surface contamination or handling residue is creating locally hydrophobic regions.
Action: Improve handling protocols and enforce clean-surface controls between calendaring and filling.
No. It's an upstream wetting screen that narrows your electrode, separator, and additive candidates before a full cell build, formation, and cycle-life testing, not a replacement for that testing.
No. It measures wetting performance, contact angle, kinetics, and surface tension, which is a strong predictor of filling behavior. Electrochemical compatibility still needs to be confirmed with impedance and cycle-life testing.
It's an apparent contact angle rather than a true equilibrium value on a porous surface, since the liquid is wicking as it's measured. Correlate it against your own filling-time data before treating it as an absolute pass/fail threshold.
Yes. Comparing surface tension, contact angle, and spreading kinetics across candidates at matched concentration is one of the more direct uses of this protocol.
Yes. Pore size, structure, and permeability set a physical ceiling on wetting rate independent of how good the electrolyte is, this is a documented root cause, not a hypothetical one.
Yes. Storage time, moisture exposure, and handling shift electrolyte composition and wetting performance even when the nominal formulation hasn't changed, standardize storage conditions for comparable results.
Yes. The Dropometer produces numeric contact angle, kinetics, and surface tension data with replicate records, timestamps, and lot identification, usable in NCR responses, CAPA files, and supplier audit packages.
| Metric | Before Dropometer | With Dropometer | Indicative Benchmark |
|---|---|---|---|
| Failure discovery point | Formation or cycle-life testing, after committing a full cell build | Contact angle and kinetics screening before cell assembly | "COPQ from late-discovered defects typically 15–20% of revenue for manufacturers without upstream gates" |
| Additive selection | Trial-and-error additive dosing validated only by full cell testing | Measured wetting performance guides candidate selection before a cell build | "Reducing trial-and-error is the outcome this page's own positioning statement already states" |
| Candidate ranking | Full cell builds and cycle-life tests across each candidate additive | Contact angle, kinetics, and surface tension comparison in a single screening run | "Structured data-driven ranking vs. full cell-build trial-and-error" |
| Batch-to-batch consistency | Unmeasured electrode or electrolyte lot variability | Tracked per batch against a wetting baseline | "Replicate spread detects drift before it reaches cell assembly" |
| Audit documentation | Subjective downstream observation; not defensible under audit | Numeric wetting logs with timestamps and lot ID | "Applicable to NCR, CAPA, incoming inspection, and supplier qualification records" |
Battery Electrolyte R&D ROI Snapshot
Result
Monthly savings = materials saved + technician time saved from reduced iterations.
Knowing the limits of any measurement tool is part of using it responsibly.
Use this page to improve additive screening and upstream troubleshooting, not to replace your formation and cycle-life testing. The Dropometer is one layer in a quality system, not a substitute for one.
The concentration-series measurement methodology this page's additive screening depends on.
A related R&D formulation-screening workflow using the same surface tension and kinetics measurement approach.
A related interfacial screening workflow, relevant since electrolyte additives can affect interfacial behavior the same way emulsifiers do in other formulations.
Editorial and technical transparency notes for this page.
Initial draft created with AI assistance (Claude 4.8 Opus Pro), then rewritten for technical clarity by Droplet Lab Staff
Technical review and editing by a surface-science specialist for accuracy
Identifiers, units, thresholds, and key claims checked against cited sources before publication
Reviewed every 12 months or when underlying standards or instrument specifications change
Spotted an issue in this summary? Send a correction request and our team will review it.
Correction Request
We work hard to keep this standards summary accurate and up to date. If you spot an error (wrong revision/year, missing requirement, incorrect interpretation, or broken link), tell us and we'll review it.
Contact us to report a correction