Contents

Oil & Gas Industry
The Practical Guide to Surface Science (2026)

?s=100&d=m
Written by
No biography added yet.
Read More
?s=100&d=m
Reviewed by
N/A
No biography added yet.
Read More
?s=100&d=m
Written By

No biography added yet.

?s=100&d=m
Reviewed By

N/A N/A

No biography added yet.

This is a practical guide to Surface Science for researchers working in the Oil & Gas Industry.

In this all-new guide you’ll learn all about:

  • Crucial surface science principles
  • The significance of surface science measurements for the Oil & Gas industry
  • Applicable ASTM Standards & Guidelines

Let’s dive right in.

Oil & Gas

Executive Summary

What it covers: A practical, Oil & Gas–focused guide to measuring and applying four core surface properties—contact angle (static + dynamic), surface tension (static + dynamic), surface energy, and sliding angle, plus where each fits in QA/QC, troubleshooting, and formulation. It also includes real-world case studies and a reporting/quality checklist to make measurements defensible and repeatable.
Key insights: Real surfaces exhibit hysteresis, so advancing/receding (dynamic) contact angles give a far more diagnostic picture than a single static value, especially for cleanliness, roughness, and heterogeneity. For droplet-shape analysis, Young–Laplace/ADSA generally gives more consistent results for axisymmetric drops, while polynomial fitting can be used when symmetry breaks; dynamic surface tension is the right tool when interfaces evolve quickly (e.g., surfactant dosing, droplet/bubble formation, foams, evaporation-driven composition changes).
Business value: Improves chemical and coating decisions, selecting surfactants for water–oil separation, tuning polymer–surfactant oilfield fluids, optimizing EOR/surfactant flooding performance, and validating hydrophobic coatings for offshore corrosion mitigation. By pairing measurements with benchmarks, controls, and clear interpretation guardrails, teams can reduce rework, energy use, and process variability while speeding root-cause troubleshooting.
Standards to follow: Use API RP 13B-2 as the backbone for OBM/SBM field testing (including Electrical Stability trending) and treat droplet-based IFT and contact-angle wettability as mechanistic augmentation, not a replacement claim of API compliance. Follow the guide’s minimum reporting checklist (sample metadata, test temperature, phase identities/composition, method details, replicates/statistics, controls, and acceptance criteria) so results are traceable and actionable.
Bottom line: This guide shows what to measure, when to measure it, and how to interpret it so surface science becomes an operational decision tool, not just a lab number. Done with disciplined methods and reporting, these measurements directly support better formulations, faster troubleshooting, and more reliable Oil & Gas processing and production outcomes.

Chapter 1: Introduction

The oil and gas industry relies heavily on precise surface property measurements. They actively measure properties like surface tension, sliding angle, surface energy, and contact angle to optimize various applications, including


Oil & Gas


We use the following surface properties to understand the behavior of Oil & Gas products and improve their quality.

Chapter 2: Contact Angle Measurement

The contact angle quantifies the wettability of a surface by representing the angle between a liquid’s surface and a solid surface.
Dropletlab Research

Sample Image taken from Droplet Lab Tensiometer.

Young – Laplace Method

Polynomial Method

Dynamic Contact Angle

Ideally, when we place a drop on a solid surface, a unique angle exists between the liquid and the solid surface. We can calculate the value of this ideal contact angle (the so-called Young’s contact angle) using Young’s equation. In practice, due to surface geometry, roughness, heterogeneity, contamination, and deformation, the contact angle value on a surface is not necessarily a single consistent value but rather falls within a range. The upper and lower limits of this range are known as the advancing and receding contact angles, respectively. The values of advancing and receding contact angles for a solid surface are highly sensitive to many parameters, such as temperature, humidity, homogeneity, and minor contamination of the surface and liquid. For example, the advancing and receding contact angles of a surface can differ at different locations.

Dynamic Contact Angle versus Static Contact Angle

Practical surfaces and coatings naturally show contact angle hysteresis, indicating a range of equilibrium values. When we measure static contact angles, we get a single value within this range. Solely relying on static measurements poses problems, like poor repeatability and incomplete surface assessment regarding adhesion, cleanliness, roughness, and homogeneity.

In practical applications, we need to understand how easily a liquid spreads (advancing angle) and how easily it is removed (receding angle), such as in painting and cleaning. Measuring advancing and receding angles offers a holistic view of liquid-solid interaction, unlike static measurements, which yield an arbitrary value within the range.

This insight is crucial for real-world surfaces with variations, roughness, and dynamics, aiding industries like cosmetics, materials science, and biotechnology in designing effective surfaces and optimizing processes.

Learn how Contact Angle measurement is done on our Tensiometer

For a more complete understanding of Contact Angle measurement, read our Contact Angle measurement: The Definitive Guide

Open Benchmark Data: Contact Angle & Surface Energy

These reference measurements show how deionized water wets four standard substrates measured with the Droplet Lab Dropometer. Use them as visual and numerical benchmarks when you're checking your own sample preparation, treatments, and chemistry.

Full contact angle and surface energy datasets (including additional liquids and statistics) are available on our dataset hub.

Glass - DI Water
Glass - DI Water
Nylon - DI Water
Nylon - DI Water
PMMA - DI Water
PMMA - DI Water
Teflon - DI Water
Teflon - DI Water

The droplet images above are taken from the same benchmark series as our open dataset. For each substrate and probe liquid we report:

● Advancing and receding contact angles (and hysteresis)
● Derived surface energy (SFE) values based on multi-liquid measurements
● Measurement conditions, uncertainties, and sample preparation details

Comparing your own droplet shapes and angles against these references is a fast way to spot contamination, treatment drift, or unexpected changes in wettability.

Chapter 3: Surface Tension Measurement

This property measures the force that acts on the surface of a liquid, aiming to minimize its surface area.

Surface Tension Measurement

Sample Image taken from Droplet Lab Tensiometer

Dynamic Surface Tension

Dynamic surface tension differs from static surface tension, which refers to the surface energy per unit area (or force acting per unit length along the edge of a liquid surface).

Static surface tension characterizes the equilibrium state of the liquid interface, while dynamic surface tension accounts for the kinetics of changes at the interface. These changes could involve the presence of surfactants, additives, or variations in temperature, pressure, and composition at the interface.

When to use Dynamic Surface Tension Measurement

Dynamic surface tension is essential for processes that involve rapid changes at the liquid-gas or liquid-liquid interface, such as droplet and bubble formation, coalescence (change in surface area), the behavior of foams, and the drying of paints (change in composition, e.g., evaporation of solvent). It is measured by analyzing the shape of a hanging droplet over time.

Dynamic surface tension applies to various industries, including cosmetics, coatings, pharmaceuticals, paint, food and beverage, and industrial processes, where understanding and controlling the behavior of liquid interfaces is essential for product quality and process efficiency.

Learn how Surface Tension measurement is done on our Tensiometer

For a more complete understanding of Surface Energy measurement, read our Surface Tension measurement: The Definitive Guide

Chapter 4: Surface Energy Measurement

Surface energy refers to the energy required to create a unit area of a new surface.
231

Sample Image taken from Droplet Lab Tensiometer

Learn how Surface Energy measurement is done on our Tensiometer

For a more complete understanding of Surface Energy measurement, read our Surface Energy measurement: The Definitive Guide

For benchmark contact angle and surface energy values on glass, nylon, PMMA, and Teflon, see the Open Benchmark Data panel above or visit our Dataset Hub for full CSV downloads.

Chapter 5: Sliding Angle Measurement

The sliding angle measures the angle at which a liquid film slides over a solid surface. It is commonly employed to assess the slip resistance of a surface.

sliding angle 1

Sample Image taken from Droplet Lab Tensiometer

Learn how Sliding Angle measurement is done on our Tensiometer

For a more complete understanding of Sliding Angle measurement, read our Sliding Angle Measurement: The Definitive Guide

Chapter 6: Real-World Applications

Within the Oil & Gas industry, several case studies exemplify the advantages of conducting surface property measurements.

Polymer–Surfactant Screening for Optimizing Fracturing/Drilling Fluid Rheology and Interfacial Behavior

The study evaluates how five surfactants (anionic, cationic, zwitterionic, and non-ionic) change the steady-shear rheology and surface activity of two polymers (cationic HEC-based LR-400 and anionic PAM-based Praestol 2540TR). Solutions show shear-thinning power-law behavior. Anionic surfactants strongly increase the consistency index and shear-thinning in the cationic polymer system, while effects on the anionic polymer are weak/modest. Surface tension decreases with surfactant concentration, and Amphosol CG is most effective at lowering surface tension and increasing conductivity. Approximate CAC and PSP are estimated from slope changes in surface-tension–concentration plots.

Role of the Droplet Lab Goniometer

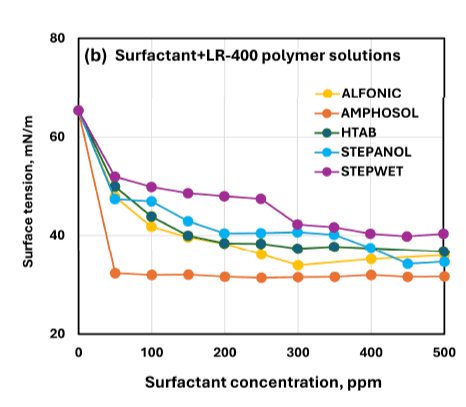
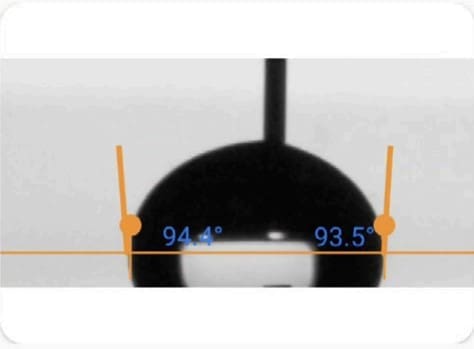
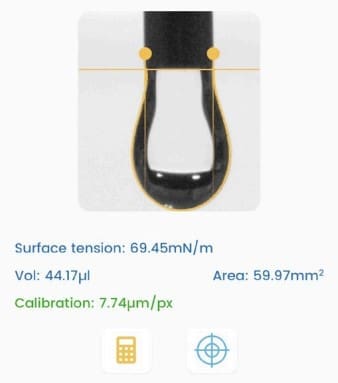
  • The Droplet Lab instrument was used specifically for surface tension measurement (not contact angle) via a smartphone-based tensiometer using ADSA (Axisymmetric Drop Shape Analysis) on pendant droplets. The Droplet Lab measurement enables quantifying how surfactant type and concentration shift interfacial properties of polymer–surfactant fluids—critical for designing oilfield fluids where interfacial behavior influences wetting/cleanup and formulation performance.
  • Where it’s mentioned in the paper: Surface tension method and Droplet Lab instrument are described in Section 2.4 “Surface Tension Measurements” (page 5), including the ADSA pendant-drop workflow and repeat measurements.

Key Findings

  • Polymer–surfactant solutions behaved as shear-thinning fluids and were fit with the power-law model (rheology context for fluid design).
  • Anionic surfactants (Stepanol WA-100, Stepwet DF-95) produced strong rheology changes in the cationic polymer (LR-400) system, increasing consistency and making the fluids more shear-thinning (useful for tuning pumpability vs. carrying capacity).
  • For anionic polymer (Praestol 2540TR), surfactants showed weak to modest effects overall on rheology (more formulation robustness to surfactant choice).
  • Surface tension decreases as surfactant concentration increases across systems (interfacial control via surfactant dosing).
  • Amphosol CG (zwitterionic) was the most effective at reducing surface tension at a given ppm concentration and produced the largest conductivity increase.
  • Approximate CAC and PSP points were inferred from slope changes in surface tension vs. concentration plots (useful for identifying “binding/saturation” regimes).

Why It Matters

For oilfield fluid formulation (hydraulic fracturing, drilling, and related EOR-adjacent workflows), the ability to quantify surface tension vs. surfactant concentration alongside rheology changes helps teams select polymer–surfactant pairs that hit performance targets (e.g., low-shear viscosity for suspension, manageable high-shear viscosity for pumping, and controlled interfacial behavior). The Droplet Lab surface tension measurements provide a practical way to set spec windows and avoid over- or under-dosing surfactants relative to interaction regimes (CAC/PSP).

Method Snapshot

  • Samples: Aqueous polymer solutions of LR-400 (cationic HEC-based) and Praestol 2540TR (anionic PAM-based) with added surfactants (Stepanol WA-100, Stepwet DF-95, HTAB, Amphosol CG, Alfonic 1412-3).
  • Droplet Lab measurement: Pendant droplet surface tension at ~22 °C using smartphone imaging + ADSA; 12 repeats per solution averaged (surface tension reported in mN/m). (No contact angle / advancing-receding angles were measured in this study.)

Data Note

Comparisons of Surface tension of different surfactants in LR-400 polymer solution.

Figure

Citation (APA Format)

Lu, Q., &; Pal, R. (2025). Steady Shear Rheology and Surface Activity of Polymer-Surfactant Mixtures. Polymers, 17(3), 364

View Publication →

Enhanced Water-Oil Separation

Offshore oil platforms face a challenge: their production stream contains significant water that forms a stubborn emulsion with the crude oil due to high surface tension. To break this unwanted bond, engineers actively lower surface tension using carefully chosen surfactants. By measuring contact angle and surface energy, they precisely select the most effective chemicals. This targeted approach improves emulsion destabilization, leading to more efficient water-oil separation and significantly reduced energy consumption during processing.

Enhanced Water-Oil Separation

Polymer Flooding

In a mature oil reservoir, researchers actively employ Enhanced Oil Recovery (EOR) methods to squeeze out more oil. To assess the reservoir rock's wettability, they precisely measure contact angles. Their discovery of mixed wettability characteristics in the rock leads them to utilize surface energy measurements to design a more effective EOR strategy. By altering the contact angle with specific surfactants or polymers, they modify the interaction between the reservoir rock and injected fluids, ultimately increasing oil recovery.

Polymer Flooding

Offshore Pipeline Protection

Offshore pipelines face the wrath of harsh seawater, leading to corrosion and a shortened lifespan. To combat this, engineers actively apply hydrophobic coatings to the pipeline surfaces. Sliding angle measurements play a crucial role in evaluating the performance of these coatings. By achieving a low sliding angle, the coatings effectively repel water, significantly reducing the risk of corrosion and extending the pipeline's life. This proactive approach also reduces maintenance costs in the long run. 

Offshore Pipeline Protection

Exploration and Production

Surface property measurements actively unlock the secrets of reservoir rocks and their fluids. By analyzing these properties, engineers precisely determine the best drilling and production techniques to maximize efficiency and success. Furthermore, surface property measurements play a crucial role in optimizing the drilling mud and cement used to seal the wellbore, ensuring safe and reliable operations.

Exploration and Production

Enhanced Oil Recovery

In enhanced oil recovery techniques like surfactant flooding, engineers actively utilize surface property measurements to optimize the process. They reduce surface tension between oil and water using surfactants, allowing for easier oil recovery. These measurements help them determine the ideal surfactant concentration and continuously monitor the effectiveness of the surfactant flooding process.

Enhanced Oil Recovery

We are your partners in solving your Business & Technological challenges

If you are interested in implementing these or any other applications, please contact us.

Chapter 7: Standards and Guidelines

In an industry where precision reigns supreme, how can Oil & Gas manufacturers ensure their products withstand scrutiny? The answer lies in standards and guidelines: the compass that guides them through the complex maze of quality and performance.

API RP 13B-2 — Field Testing Oil-Based/Synthetic-Based Drilling Fluids (incl. Electrical Stability)

What it is

API RP 13B-2 is a recommended practice that defines field test procedures for oil-based and synthetic-based (invert-emulsion) drilling fluids, including the Electrical Stability (ES) test. Dropometer fits as a diagnostic companion by adding oil–brine interfacial tension (IFT) and solids/coupon wettability measurements to help explain why an ES trend is changing.

When to use it

Routine OBM/SBM QA/QC trending

Run RP 13B-2 field tests (especially ES) as your operational “early warning,” and add IFT/wettability when you need mechanism behind drift.

Troubleshooting after an upset or treatment change

When ES shifts after dilution, contamination, solids changes, or chemical additions, use IFT + wettability to narrow whether the issue is primarily interfacial chemistry vs solids wetting.

In-scope / Out-of-scope

In scope
  • RP 13B-2 field testing for OBM/SBM, including Electrical Stability (ES) as a trended condition indicator
  • Mechanistic augmentation (not replacement): oil–brine IFT via pendant-drop (controlled temperature/composition)
  • Wettability verification: contact-angle–based indicator (site-defined geometry) on representative substrates (steel/shale/cuttings analogs)
  • Trend correlation: ES (field) plotted alongside IFT and wettability indicators to support hypothesis-driven treatment decisions
Out of scope
  • Replacing RP 13B-2 or claiming API compliance/certification via Dropometer results (it’s an augmentation tool, not a standard)
  • Single-cause diagnosis from ES alone (ES is multi-factor and should not be treated as a one-to-one “root cause” meter)
  • Full additive R&D programs unless explicitly scoped (e.g., broad surfactant screening beyond a targeted optimization study)
  • Optically invalid measurements without documented controls/acceptance criteria (e.g., non-axisymmetric drops, poor edge detection, uncontrolled temperature/density inputs)

Minimum you must report (checklist)

  • Electrical Stability (ES) result(s) being trended (value + date/time + instrument/procedure reference)
  • Sample metadata: mud system (OBM/SBM), well/section, sampling method, temperature, time since last treatment/dilution, notable contamination/solids observations
  • Oil & brine identities/composition used for IFT (source, salinity/chemistry, and whether phases were extracted or prepared)
  • IFT result (mN/m) with method (pendant drop), test temperature, densities used for fitting, and replicate count + summary statistic (mean ± SD or median + spread)
  • Wettability indicator (contact angle metric) with substrate/coupon type, surface prep/conditioning, geometry/environment, replicate/spot count + summary statistic
  • Trend plots: ES vs time; IFT vs time; wettability indicator vs time (and ES vs IFT if you’re correlating)
  • Controls: reference oil–brine pair and/or “golden” OBM sample frequency + results; reference coupon with known response
  • Data-quality outcomes: acceptance limits and any rejected/re-run points (e.g., drop symmetry, fit residual thresholds, temperature/density tolerances)

ES is best treated as a high-sensitivity trend indicator, not a stand-alone explanation of what failed. IFT and wettability thresholds must be site-calibrated against your own KPIs (rheology/sag/filtration/torque-drag/NPT signals) before being used as action limits.

How to interpret results (guardrails)

  • Use ES as the trigger, not the diagnosis: ES drift tells you “something changed,” while IFT/wettability help narrow what kind of change is most likely.
  • IFT rising with little wettability change → consistent with weakening interfacial-active chemistry (emulsifier effectiveness/brine chemistry/contamination hypotheses); prioritize brine verification, emulsifier strategy, contamination checks.
  • Wettability shifting toward water-wet with normal IFT → consistent with solids wetting program slipping (wetting agent depletion/solids conditioning/solids loading); prioritize solids control and wetting-agent strategy review.
  • ES noisy + IFT/wettability variable → likely multi-factor change and/or sampling heterogeneity; standardize sampling/conditioning, repeat with controls, and avoid chemistry-altering “over-filtration.”

Now It’s Your Turn

We hope this guide showed you how to apply surface science in the Oil & Gas industry.

Now we’d like to turn it over to you: 

Feel free to leave a comment below—we’d love to hear from you.

Leave a Reply

Your email address will not be published. Required fields are marked *


Download Experiment