








Contents

Paint Industry
The Practical Guide to Surface Science (2026)

D54c15105cfe94f786c500e4091d6ea65457608fde49ba183c8f862814a54249?s=100&d=m
Written by
Dr Amit Pratap Singh
PhD, Delhi University Post Doc - AIST Japan
Guest Author
Read More
alidad
Reviewed by
Dr Alidad Amirfazli
Dr. Amirfazli, a leading expert in surface wetting and superhydrophobic coatings, has 250+ publications, edits Advances in Colloid and Interface Science, and has received multiple research awards.
Scientific Advisor & Co-founder
Read More
D54c15105cfe94f786c500e4091d6ea65457608fde49ba183c8f862814a54249?s=100&d=m
Written By

Dr Amit Pratap Singh

Guest Author

PhD, Delhi University

Post Doc - AIST Japan

alidad
Reviewed By

Dr Alidad Amirfazli

Scientific Advisor & Co-founder

Dr. Amirfazli, a leading expert in surface wetting and superhydrophobic coatings, has 250+ publications, edits Advances in Colloid and Interface Science, and has received multiple research awards.

This is a practical guide to Surface Science for researchers working in the Paint Industry.

In this all-new guide you’ll learn all about:

  • Crucial surface science principles
  • The significance of surface science measurements for the Paint industry
  • Applicable ASTM Standards & Guidelines

Let’s dive right in.

Paint

Executive Summary

What it covers: How paint and coatings teams use contact angle, surface free energy, surface tension and sliding angle on metal, glass and concrete. Each measurement is tied to a real defect, such as peeling, fisheyes, crawling or orange peel.
Key insights: As a rule of thumb, a paint wets a substrate well only when its surface tension is below the substrate’s surface free energy. Many adhesion failures trace back to a surface that was not clean or treated enough, which a water contact angle can show before painting. Surface tension of the wet paint drives flow, levelling and defects such as craters.
Business value: Checking the substrate before painting catches a bad clean or pretreatment before it becomes a failed tape test or a field complaint. One portable kit covers all four measurements, so it can go to the line, the panel room or the job site.
Standards to follow: ISO 19403-2 describes surface free energy of solids from contact angles. Other parts of ISO 19403 cover liquid surface tension, dynamic contact angle and the tilting plate. ASTM D8597 covers contact angle with portable goniometers, and ASTM D7541 covers critical surface tension. ASTM D3359 is a tape adhesion test, not a wetting method.
Bottom line: Measure contact angle on the substrate before you paint, and surface tension of the paint while you formulate. Start with the defect you see most, then book a 15 minute demo to try it on your own panels.

Chapter 1: Introduction

In paint and coatings, many visible defects start at an interface. Paint that peels from metal often went onto a surface that was not clean enough. Fisheyes and craters appear when the wet film cannot wet a contaminated spot.

These are the places where wetting decides yield in paint work:

The Dropometer contact angle and surface tension kit measures contact angle, surface tension, surface free energy and sliding angle with one portable setup. Its method was validated against a KRUSS DSA100E in two peer reviewed papers. If you are new to the terms, start with wettability.

We use the following surface properties to understand the behavior of Paint products and improve their quality.

Chapter 2: Contact Angle Measurement

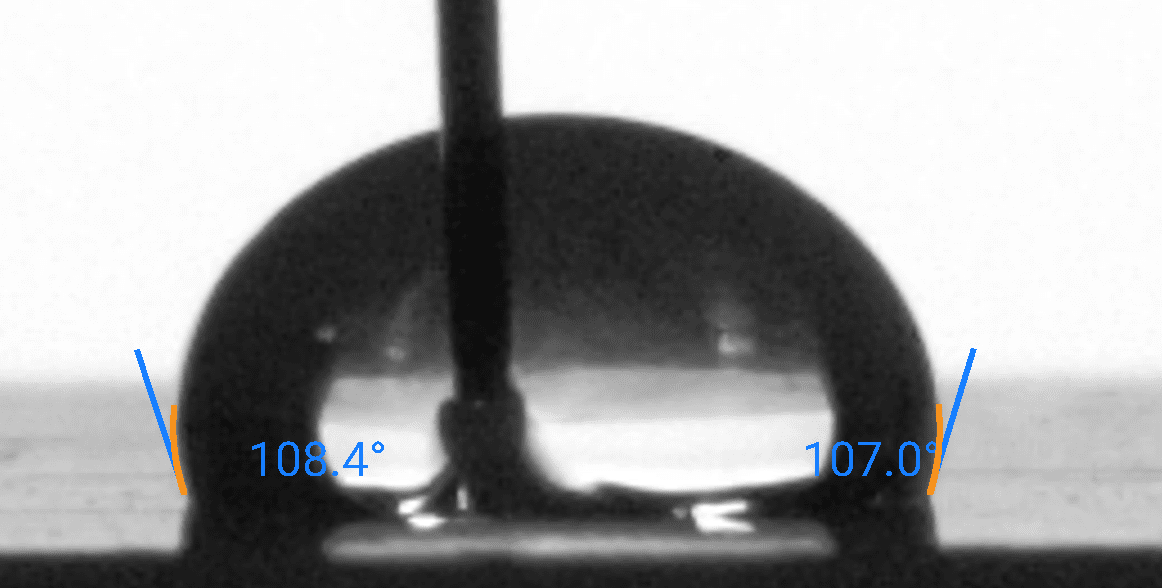
The contact angle quantifies the wettability of a surface by representing the angle between a liquid’s surface and a solid surface.
Dropletlab Research

Sample Image taken from Droplet Lab Tensiometer.

Young – Laplace Method

Polynomial Method

Dynamic Contact Angle

Ideally, when we place a drop on a solid surface, a unique angle exists between the liquid and the solid surface. We can calculate the value of this ideal contact angle (the so-called Young’s contact angle) using Young’s equation. In practice, due to surface geometry, roughness, heterogeneity, contamination, and deformation, the contact angle value on a surface is not necessarily a single consistent value but rather falls within a range. The upper and lower limits of this range are known as the advancing and receding contact angles, respectively. The values of advancing and receding contact angles for a solid surface are highly sensitive to many parameters, such as temperature, humidity, homogeneity, and minor contamination of the surface and liquid. For example, the advancing and receding contact angles of a surface can differ at different locations.

Dynamic Contact Angle versus Static Contact Angle

Practical surfaces and coatings naturally show contact angle hysteresis, indicating a range of equilibrium values. When we measure static contact angles, we get a single value within this range. Solely relying on static measurements poses problems, like poor repeatability and incomplete surface assessment regarding adhesion, cleanliness, roughness, and homogeneity.

In practical applications, we need to understand how easily a liquid spreads (advancing angle) and how easily it is removed (receding angle), such as in painting and cleaning. Measuring advancing and receding angles offers a holistic view of liquid-solid interaction, unlike static measurements, which yield an arbitrary value within the range.

This insight is crucial for real-world surfaces with variations, roughness, and dynamics, aiding industries like cosmetics, materials science, and biotechnology in designing effective surfaces and optimizing processes.

Learn how Contact Angle measurement is done on our Tensiometer

For a more complete understanding of Contact Angle measurement, read our Contact Angle measurement: The Definitive Guide

Open Benchmark Data: Contact Angle & Surface Energy

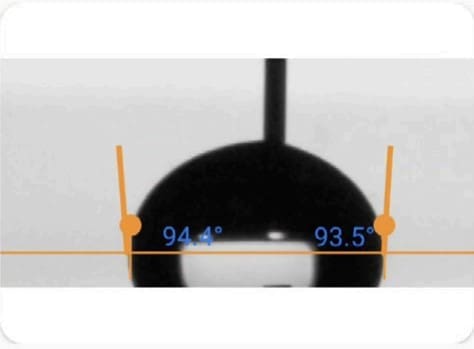
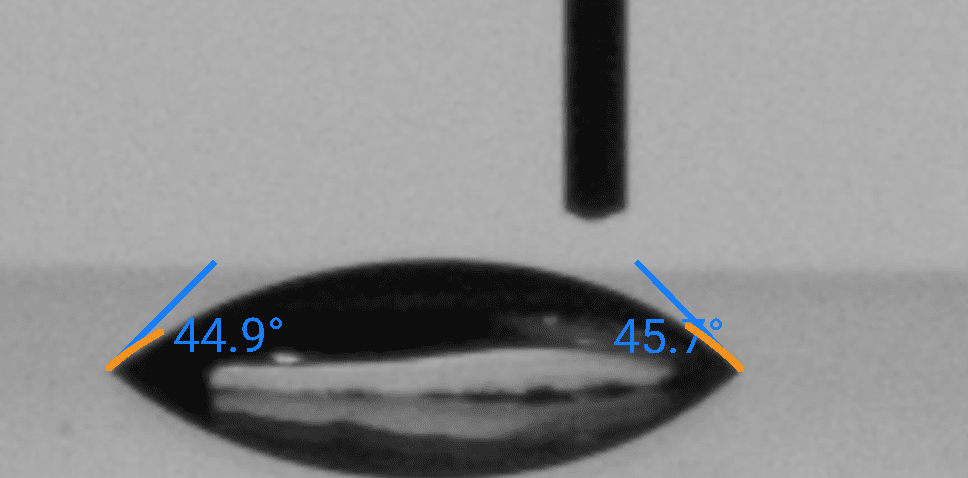
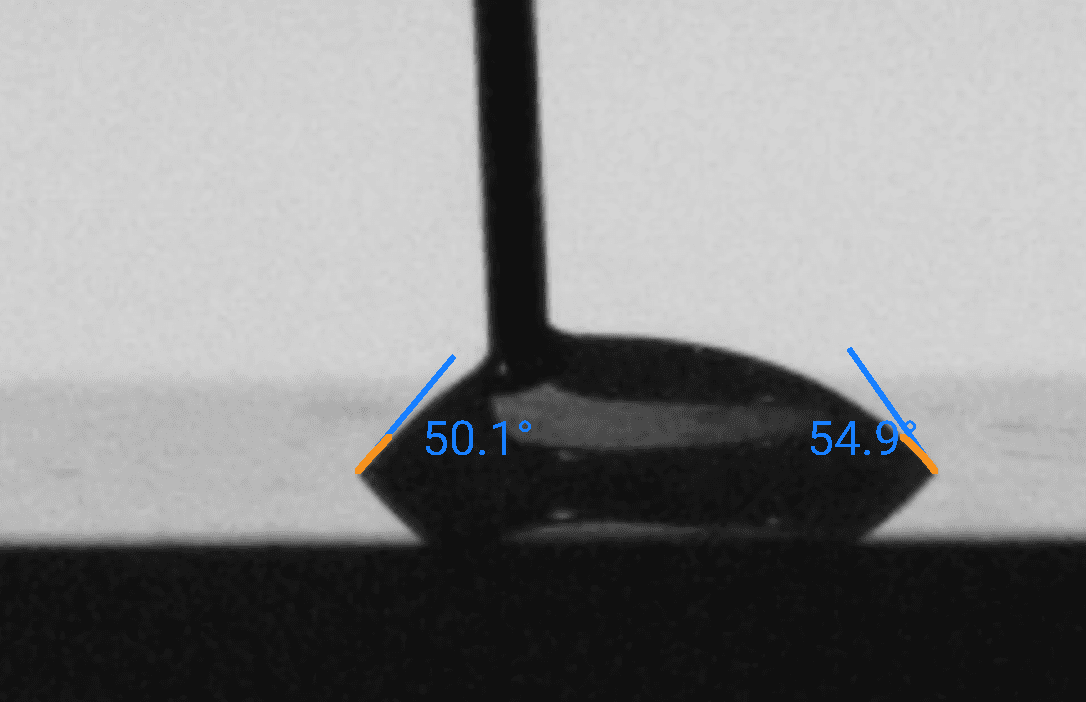
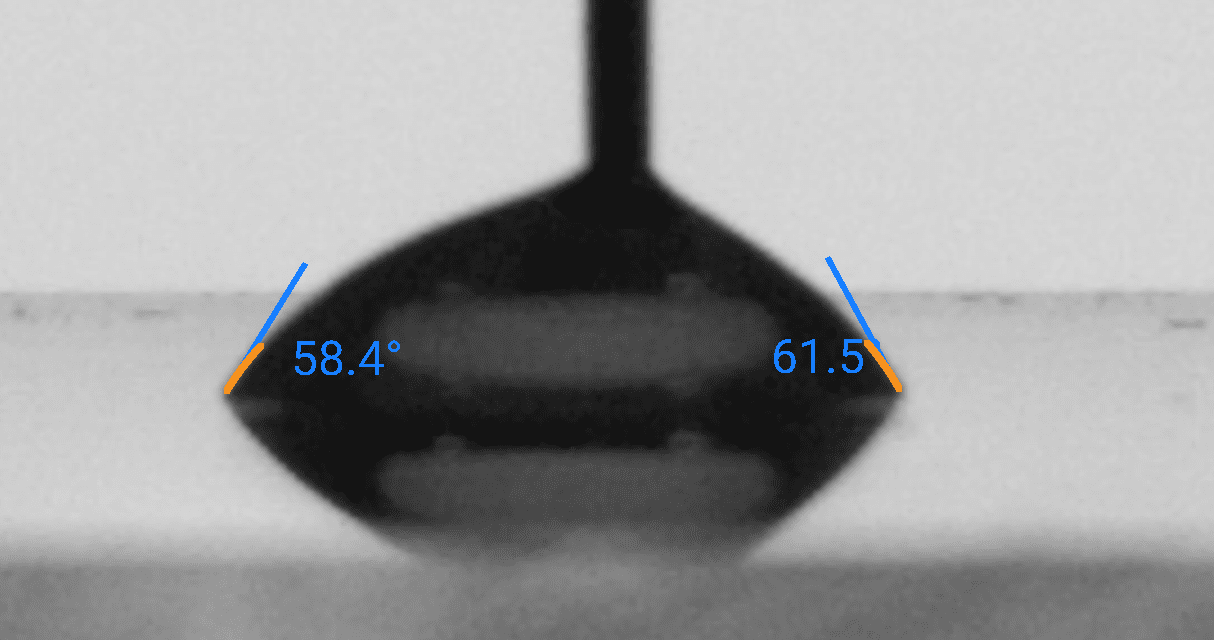
These reference measurements show how deionized water wets four standard substrates measured with the Droplet Lab Dropometer. Use them as visual and numerical benchmarks when you're checking your own sample preparation, treatments, and chemistry.

Full contact angle and surface energy datasets (including additional liquids and statistics) are available on our dataset hub.

Glass - DI Water
Glass - DI Water
Nylon - DI Water
Nylon - DI Water
PMMA - DI Water
PMMA - DI Water
Teflon - DI Water
Teflon - DI Water

The droplet images above are taken from the same benchmark series as our open dataset. For each substrate and probe liquid we report:

● Advancing and receding contact angles (and hysteresis)
● Derived surface energy (SFE) values based on multi-liquid measurements
● Measurement conditions, uncertainties, and sample preparation details

Comparing your own droplet shapes and angles against these references is a fast way to spot contamination, treatment drift, or unexpected changes in wettability.

Chapter 3: Surface Tension Measurement

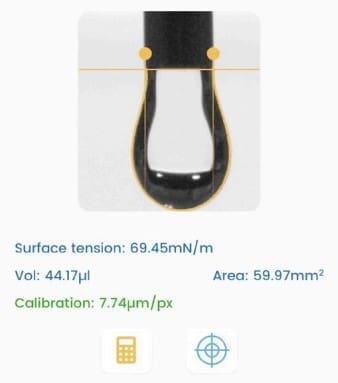
This property measures the force that acts on the surface of a liquid, aiming to minimize its surface area.

Surface Tension Measurement

Sample Image taken from Droplet Lab Tensiometer

Dynamic Surface Tension

Dynamic surface tension differs from static surface tension, which refers to the surface energy per unit area (or force acting per unit length along the edge of a liquid surface).

Static surface tension characterizes the equilibrium state of the liquid interface, while dynamic surface tension accounts for the kinetics of changes at the interface. These changes could involve the presence of surfactants, additives, or variations in temperature, pressure, and composition at the interface.

When to use Dynamic Surface Tension Measurement

Dynamic surface tension is essential for processes that involve rapid changes at the liquid-gas or liquid-liquid interface, such as droplet and bubble formation, coalescence (change in surface area), the behavior of foams, and the drying of paints (change in composition, e.g., evaporation of solvent). It is measured by analyzing the shape of a hanging droplet over time.

Dynamic surface tension applies to various industries, including cosmetics, coatings, pharmaceuticals, paint, food and beverage, and industrial processes, where understanding and controlling the behavior of liquid interfaces is essential for product quality and process efficiency.

Learn how Surface Tension measurement is done on our Tensiometer

For a more complete understanding of Surface Energy measurement, read our Surface Tension measurement: The Definitive Guide

Chapter 4: Surface Energy Measurement

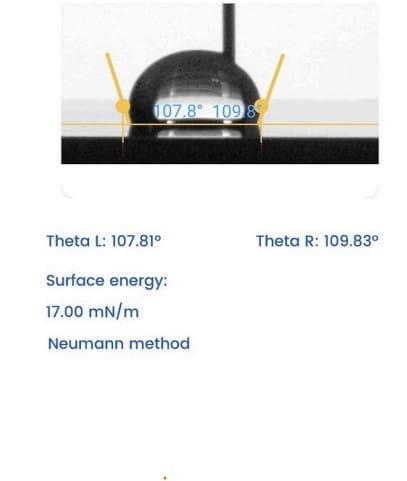
Surface energy refers to the energy required to create a unit area of a new surface.
231

Sample Image taken from Droplet Lab Tensiometer

Learn how Surface Energy measurement is done on our Tensiometer

For a more complete understanding of Surface Energy measurement, read our Surface Energy measurement: The Definitive Guide

For benchmark contact angle and surface energy values on glass, nylon, PMMA, and Teflon, see the Open Benchmark Data panel above or visit our Dataset Hub for full CSV downloads.

Chapter 5: Sliding Angle Measurement

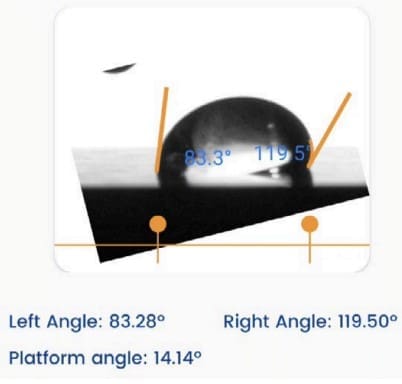
The sliding angle measures the angle at which a liquid film slides over a solid surface. It is commonly employed to assess the slip resistance of a surface.

sliding angle 1

Sample Image taken from Droplet Lab Tensiometer

Learn how Sliding Angle measurement is done on our Tensiometer

For a more complete understanding of Sliding Angle measurement, read our Sliding Angle Measurement: The Definitive Guide

Chapter 6: Real-World Applications

Within the Paint industry, several case studies exemplify the advantages of conducting surface property measurements.

Influence of Surfactants on the Rheological Behavior of Nanocrystal Suspension

The authors evaluate how two common ionic surfactant classes, anionic sodium lauryl sulfate (Stepanol) and cationic HTAB, affect a 1 wt% cellulose nanocrystal (NCC) aqueous suspension over 0-500 ppm surfactant. They quantify steady-shear rheology (power-law parameters) and run surface tension and conductivity in parallel to interpret surfactant-NCC interactions. A key outcome is that cationic surfactant additions can trigger a sharp thickening/network formation above ~300 ppm, whereas the anionic surfactant shows comparatively minor rheology impact over the same range.

Role of the Droplet Lab Goniometer

In this work, a Droplet Lab smartphone-based pendant drop tensiometer was used to measure surface tension of:

  • NCC dispersion (1 wt%) and
  • surfactant-NCC mixtures across 0-500 ppm surfactant.
     

Paint-relevance of this measurement:
Surface tension is a formulation-critical lever for wetting, flow/leveling, defect control (craters/fisheyes), pigment dispersion behavior, and foaming tendency in waterborne paints. Here, surface tension trends were used as a practical indicator of surfactant adsorption/migration behavior that coincided with major rheology shifts, exactly the type of compatibility signal paint formulators want early in screening.
Key Findings

  • All systems remained strongly shear-thinning and were described well by a power-law model (important for application methods like brushing/rolling/spraying where shear varies widely).
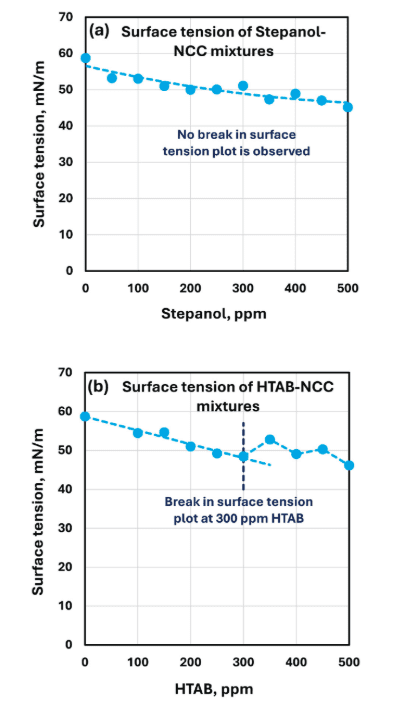
  • Anionic surfactant (Stepanol/SLS) + NCC: rheology impact was weak over 0-500 ppm; consistency index fluctuated without a clear trend, and no breakpoint appeared in conductivity or surface tension curves.
  • Cationic surfactant (HTAB) + NCC: rheology impact was strong above ~300 ppm:consistency index shoots up and the mixture becomes more shear-thinning (flow behavior index drops).
  • Surface tension behavior (Droplet Lab):
    • decreases with surfactant concentration as expected, but
  • HTAB-NCC shows a clear break around ~300 ppm (Figure 15), aligning with the rheology transition region.
    The authors interpret the HTAB transition as charge neutralization and network formation/flocculation of NCC, consistent with conductivity + rheology trends.

Why It Matters

Waterborne paint performance depends on a controlled balance between rheology modifiers (for sag resistance, settling control, spatter control, and application feel) and surfactant/dispersant packages (for wetting and stabilization). This paper provides a cautionary compatibility lesson: introducing certain cationic surfactant chemistries into a negatively charged nanocellulose-thickened system can cause sudden viscosity jumps and stronger shear-thinning, which may translate to poor pumpability, spray issues, leveling defects, or unexpected structure build during storage. Using surface tension measurements alongside rheology offers a fast, formulation-relevant way to screen additive interactions and define safer concentration windows before scale-up.

Method Snapshot

  • Sample: 1 wt% NCC aqueous dispersion; ionic surfactant added 0-500 ppm (Stepanol or HTAB), mixed at ~22 °C.
  • Droplet method: Pendant drop at a stainless-steel needle tip (1.8 mm diameter); imaged by smartphone; Young-Laplace fit used to compute surface tension; 30 repeats per fluid, averaged; room temperature.

Data Note

Figure 15 shows surface tension vs. surfactant concentration for Stepanol-NCC and HTAB-NCC mixtures (Droplet Lab pendant drop tensiometry), including the HTAB breakpoint near ~300 ppm.

Figure

Citation (APA Format)

Pal, A., & Pal, R. (2025). Influence of surfactants on the rheological behavior of nanocrystal suspension (Version 1) [Preprint]. Preprints.org.

View Publication →

Paint adhesion on metal

Paint and powder coat peel from metal when oil, residue or a weak pretreatment stops the coating from wetting the surface. Water contact angle at fixed spots shows whether the metal is clean. Surface free energy from two or more probe liquids shows whether it suits a given coating.

ASTM D3359 rates adhesion with a tape test after the paint has cured. Contact angle is a check before coating, not a substitute for that test. ISO 19403-2 describes the surface free energy method, and our peeling and adhesion failures page sets out the test plan.

Paint adhesion on metal

Anti fog coatings on glass

Glass fogs when water condenses as tiny drops that scatter light. Anti fog coatings make the surface wet so well that water spreads into a clear film, which shows up as a very low water contact angle.

EN ISO 19403-6 describes dynamic contact angle on paints and varnishes, which also shows how even the coated surface is. Track water contact angle after cleaning and ageing to check the coating still spreads water. See spreading for the background.

Anti fog coatings on glass

Durable coatings on concrete

Concrete is porous and alkaline, so a sealer or coating must wet it well and then keep water out. Contact angle on the sealed surface shows water repellency, and sliding angle shows how easily water runs off. On bare concrete a drop soaks in, so measure after sealing.

ISO 19403-7 describes the tilting plate sliding angle test for coated surfaces. ASTM D8597 describes contact angle with portable goniometers on coatings, substrates and pigments. A portable kit lets you test on site as well as on lab panels; see our sliding angle measurement guide.

Durable coatings on concrete

We are your partners in solving your Business & Technological challenges

If you are interested in implementing these or any other applications, please contact us.

Chapter 7: Standards and Guidelines

In an industry where precision reigns supreme, how can Paint manufacturers ensure their products withstand scrutiny? The answer lies in standards and guidelines: the compass that guides them through the complex maze of quality and performance.

ISO 19403-2:2024, Paints and varnishes, Wettability, Part 2: Determination of the surface free energy of solid surfaces by measuring the contact angle

What it is

Specifies an optical contact-angle method and calculation approach to determine the surface free energy (SFE) of solid surfaces from measured contact angles. Applicable to both substrates and coatings when the protocol (liquids, timing, and analysis model) is controlled and reported consistently.

When to use it

Substrate/coating readiness (incoming QC / pre-coat gate)

Use it to confirm a surface is consistently wetting under a locked method before committing to downstream coating or adhesion testing.

Process/treatment drift & root-cause triage

Use it to detect and localize changes caused by cleaning/pretreatment, formulation shifts, or cure/process drift using trends in contact angle and SFE vs a baseline/reference.

In-scope / Out-of-scope

In scope
  • Solid surfaces including substrates and coatings (e.g., metal, polymer, glass, e-coated/clearcoated panels)
  • Optical contact-angle measurement (typical implementation: sessile-drop goniometry under controlled conditions)
  • Use of probe liquids with known properties suitable for the chosen SFE calculation approach
  • Determination and reporting of SFE (total SFE and, when using a component method, dispersive/polar components per the selected model)
Out of scope
  • Direct adhesion performance certification (e.g., crosshatch, pull-off, durability), this standard supports prediction/diagnosis, not replacement of adhesion tests
  • Universal pass/fail thresholds (limits must be calibrated to your specific coating/substrate/pretreatment system and outcomes)
  • Direct measurement of liquid surface tension (probe-liquid properties must be known/defined from appropriate sources)
  • Uncontrolled/unstable droplet behavior on very rough, porous, swelling, or strongly absorbing surfaces without additional controls (angles can be time-dependent and edge fits can be unreliable)

Minimum you must report (checklist)

  • ISO edition used (19403-2:2017 or 19403-2:2024) and any deviations from your internal SOP / the referenced edition
  • Surface description (substrate/coating type, finish, lot, pretreatment/cleaning steps, cure status, and time since treatment/coating if relevant)
  • Measurement geometry & instrument method (optical contact angle method; sessile drop if used; analysis software/version)
  • Probe liquids used (identity) and the liquid property set used for the model (e.g., total surface tension and component values if applicable)
  • Droplet volume and dispense method (and any needle/dispense settings that affect droplet formation)
  • Timestamp for angle evaluation after deposition (and any additional timepoints if used)
  • Replicates & sampling plan (number of spots, where measured), plus summary statistics (e.g., median θ and variability such as IQR)
  • Analysis/fitting + SFE model details (edge/fit method, fit QC accept/reject rule, SFE model used, e.g., a component model such as OWRK/Wu if that is your ISO-aligned choice, and reported outputs: γS,total and components if calculated)

Surface free energy values are model- and liquid-set-dependent, so treat them as conditional results under a locked protocol rather than absolute constants. Align your documentation to the ISO 19403-2 edition your quality system references, and calibrate any QC thresholds to real adhesion/defect outcomes.

How to interpret results (guardrails)

  • Use fixed-time comparisons only: Lower θ at the defined timestamp generally indicates better wetting, but only compare against your own baseline using the same liquid, volume, timing, and model.
  • Separate “shift” vs “non-uniformity”: A systematic change in median θ (or γS trend) suggests process drift; a high IQR/spot spread suggests contamination streaks, non-uniform pretreatment, heterogeneous cure, or coating defects.
  • Treat high variability as a stop-and-triage signal: If fit QC fails or IQR spikes, re-run the spot and investigate upstream causes before making lot-level decisions.
  • Make gates defensible with correlation: Green/Yellow/Red limits are only valid after you correlate θ/IQR/(optional) γS trends to your downstream truth metric (adhesion, defect rate, scrap/rework), and you should re-calibrate when materials or processes change.

Now It’s Your Turn

We hope this guide showed you how to apply surface science in the Paint industry.

Now we’d like to turn it over to you: 

Feel free to leave a comment below—we’d love to hear from you.

Frequently asked questions

Which surface measurement should a paint lab start with?

Start with the defect you see most. Use contact angle on the substrate for peeling and adhesion problems, and surface tension of the paint for fisheyes, craters and orange peel. Use surface free energy when you qualify a new substrate, and sliding angle for repellent or easy clean finishes. Our contact angle and surface tension guides explain each method.

Why does my paint form fisheyes or craters?

Usually a spot of low surface tension contamination, such as oil or silicone, sits on the substrate or in the paint. The wet film pulls away from that spot, a form of dewetting. Measure paint surface tension and substrate contact angle on good and bad panels to find the source. Our coating defects troubleshooting page sets out the steps.

Can surface tension help fix orange peel?

Yes, as one part of the picture. Orange peel comes from poor flow and levelling, which depend on surface tension, viscosity and film thickness. Measure surface tension of each batch, and dynamic surface tension for sprayed paints. EN ISO 19403-3 describes surface tension of coating liquids by the pendant drop method. See our orange peel use case.

How do I measure surface free energy of a substrate before painting?

Measure contact angles of two or more probe liquids on the substrate, often water and diiodomethane, then calculate surface free energy. ISO 19403-2 describes this method for paints and varnishes. Our contact angle to surface energy calculator does the sums. ASTM D7541 describes a related value, the critical surface tension.

Which standards apply to paint wetting and adhesion?

ISO 19403 covers surface free energy (part 2), liquid surface tension by pendant drop (part 3), dynamic contact angle (part 6) and the tilting plate (part 7). ASTM D8597 covers portable contact angle and ASTM D7541 covers critical surface tension. ASTM D3359 measures adhesion by tape. The Dropometer uses sessile drop and pendant drop, so check which method your specification names.

How accurate is the Dropometer?

The drop shape method was validated against a KRUSS DSA100E in two peer reviewed papers, one in Review of Scientific Instruments and one in Colloids and Surfaces A. Published contact angle accuracy is 0.35 degrees. Automatic edge and baseline detection gives the same reading from the same image. See our validation papers.

Can contact angle predict a tape test result?

No. Contact angle shows whether a surface is ready for coating, so it flags adhesion risk early. Cure, coating chemistry and failure mode also decide the result. Use contact angle to catch poor surfaces before you paint, and confirm adhesion with ASTM D3359. The glossary entry on work of adhesion explains the link.

Standards, evidence and resources

1. Industry standards Use cases
  • Fix orange peel finish: Once spray setup and film build are ruled out, batch surface tension, read with viscosity, shows whether a paint change is hurting flow and levelling.
  • Peeling and adhesion failures in paint and powder coat: Water contact angle and surface free energy on metal before coating show a bad clean or weak pretreatment early, and teams then confirm adhesion with ASTM D3359 tape tests.
  • Stop fisheyes, craters and crawling: Paint surface tension and substrate contact angle on good and bad panels trace the low surface tension spot, such as oil or silicone, that pulls the wet film away.
Case studies Example scenario: checking pretreated steel before powder coating. A powder coating line sees occasional peeling on steel parts after a change of degreaser. The quality team measures water contact angle at fixed spots on parts after pretreatment, compares the readings with parts known to coat well, and holds back any batch that reads differently until the wash stage is checked. Adhesion on the held parts is then confirmed with the tape test. Client citations (our analysis of each paper) Example scenario: studying crater formation in a waterborne coating. A university coatings group wants to know why a waterborne clear coat forms craters when the level of a flow additive changes. The researchers measure surface tension of each formulation by pendant drop and contact angle of the wet paint on clean and deliberately contaminated panels, then compare the readings with crater counts on sprayed panels. The study would report how surface tension differences relate to where craters form. Use case collections Further resources