Contents

Transportation Industry
The Practical Guide to Surface Science (2026)

?s=100&d=m
Written by
No biography added yet.
Read More
?s=100&d=m
Reviewed by
N/A
No biography added yet.
Read More
?s=100&d=m
Written By

No biography added yet.

?s=100&d=m
Reviewed By

N/A N/A

No biography added yet.

This is a practical guide to Surface Science for researchers working in the Transportation Industry.

In this all-new guide you’ll learn all about:

  • Crucial surface science principles
  • The significance of surface science measurements for the Transportation industry
  • Applicable ASTM Standards & Guidelines

Let’s dive right in.

Cargo ship on the river

Executive Summary

What it covers: A practical, transportation-focused guide to surface science that explains how to measure and interpret contact angle (static + dynamic), surface tension (including dynamic), surface energy, and sliding angle, and where each measurement fits in real transportation workflows (coatings, bonding, cleaning, anti-icing).
Key insights: Static contact angles often hide real-world behavior; advancing/receding (dynamic) angles and hysteresis better reveal wetting, dewetting, contamination, and surface non-uniformity. Method choice matters (Young–Laplace is more consistent but assumes axisymmetry; polynomial fitting is more flexible but more sensitive to local defects), and dynamic surface tension is the right tool when interfaces change quickly (droplet/bubble formation, foams, solvent evaporation).
Business value: Helps transportation teams reduce coating and bonding defects (fisheyes, craters, adhesion loss) by catching surface treatment decay, contamination, and process drift earlier; before costly rework or scrap. Enables performance-driven surface design for high-impact problems like anti-icing/de-icing coatings and anti-adhesive, corrosion-resistant surfaces on aerospace/automotive alloys by linking measurable wetting/sliding behavior to functional outcomes.
Standards to follow: ISO 19403-6:2024 for dynamic advancing/receding contact angle by droplet volume change, including hysteresis and spot-to-spot variability reporting for coated panels/substrates. Use it alongside internal SOP controls (needle geometry, dosing rate, dwell, leveling, QC rules) to keep measurements comparable and defensible in R&D and QC.
Bottom line: This is a measurement-first, application-driven playbook for transportation surfaces; showing what to measure, why it matters, and how to use dynamic wetting and sliding behavior as early warning signals and design targets for more reliable coatings, bonding, and anti-icing performance.

Chapter 1: Introduction

The transportation industry boasts a diverse range of service providers, encompassing air, road, rail, and sea transport. It extends beyond just movement, also including warehousing, handling, stevedoring, and value-added services like packaging, labeling, and assembly. Optimizing surface characteristics according to the specific needs of each service plays a crucial role in all these areas, ultimately enhancing overall efficiency.

We use the following surface properties to understand the behavior of Transportation products and improve their quality.

Chapter 2: Contact Angle Measurement

The contact angle quantifies the wettability of a surface by representing the angle between a liquid’s surface and a solid surface.
Dropletlab Research

Sample Image taken from Droplet Lab Tensiometer.

Young – Laplace Method

Polynomial Method

Dynamic Contact Angle

Ideally, when we place a drop on a solid surface, a unique angle exists between the liquid and the solid surface. We can calculate the value of this ideal contact angle (the so-called Young’s contact angle) using Young’s equation. In practice, due to surface geometry, roughness, heterogeneity, contamination, and deformation, the contact angle value on a surface is not necessarily a single consistent value but rather falls within a range. The upper and lower limits of this range are known as the advancing and receding contact angles, respectively. The values of advancing and receding contact angles for a solid surface are highly sensitive to many parameters, such as temperature, humidity, homogeneity, and minor contamination of the surface and liquid. For example, the advancing and receding contact angles of a surface can differ at different locations.

Dynamic Contact Angle versus Static Contact Angle

Practical surfaces and coatings naturally show contact angle hysteresis, indicating a range of equilibrium values. When we measure static contact angles, we get a single value within this range. Solely relying on static measurements poses problems, like poor repeatability and incomplete surface assessment regarding adhesion, cleanliness, roughness, and homogeneity.

In practical applications, we need to understand how easily a liquid spreads (advancing angle) and how easily it is removed (receding angle), such as in painting and cleaning. Measuring advancing and receding angles offers a holistic view of liquid-solid interaction, unlike static measurements, which yield an arbitrary value within the range.

This insight is crucial for real-world surfaces with variations, roughness, and dynamics, aiding industries like cosmetics, materials science, and biotechnology in designing effective surfaces and optimizing processes.

Learn how Contact Angle measurement is done on our Tensiometer

For a more complete understanding of Contact Angle measurement, read our Contact Angle measurement: The Definitive Guide

Open Benchmark Data: Contact Angle & Surface Energy

These reference measurements show how deionized water wets four standard substrates measured with the Droplet Lab Dropometer. Use them as visual and numerical benchmarks when you're checking your own sample preparation, treatments, and chemistry.

Full contact angle and surface energy datasets (including additional liquids and statistics) are available on our dataset hub.

Glass - DI Water
Glass - DI Water
Nylon - DI Water
Nylon - DI Water
PMMA - DI Water
PMMA - DI Water
Teflon - DI Water
Teflon - DI Water

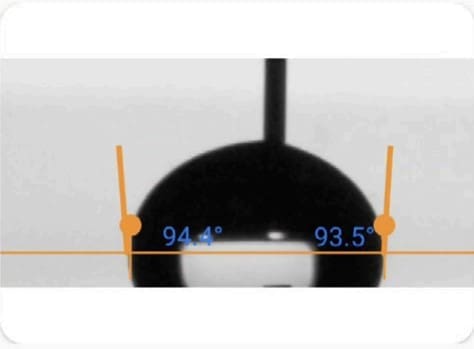
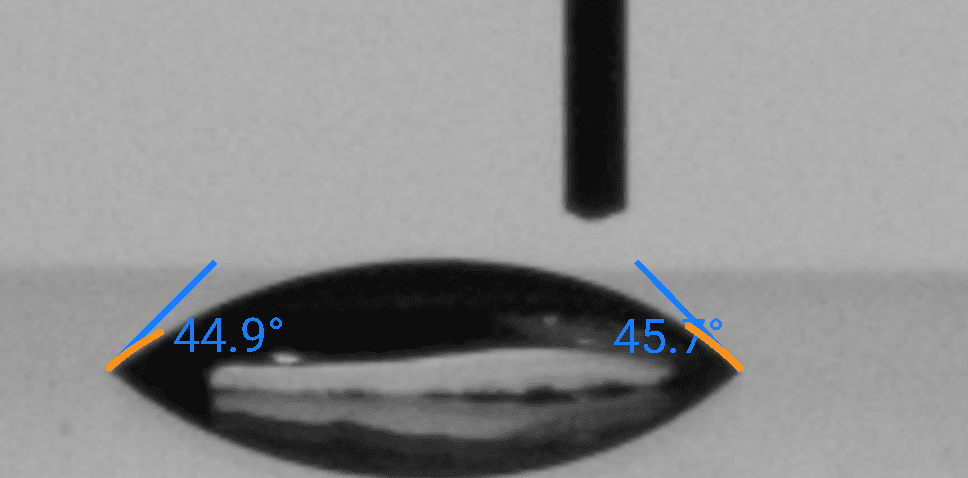
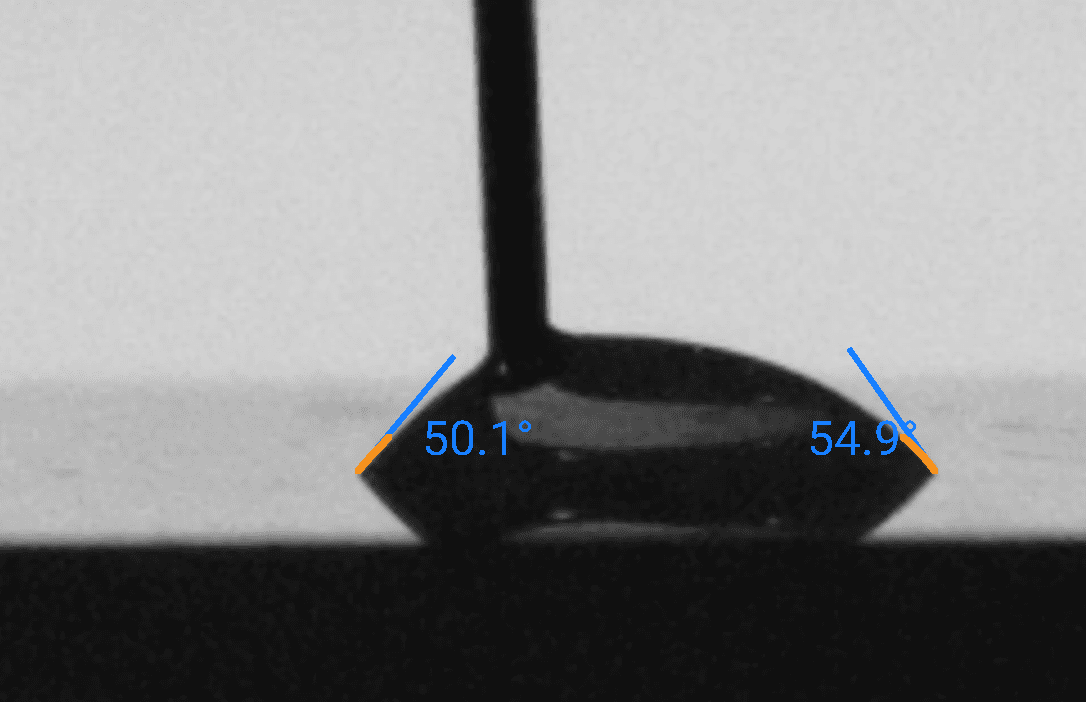
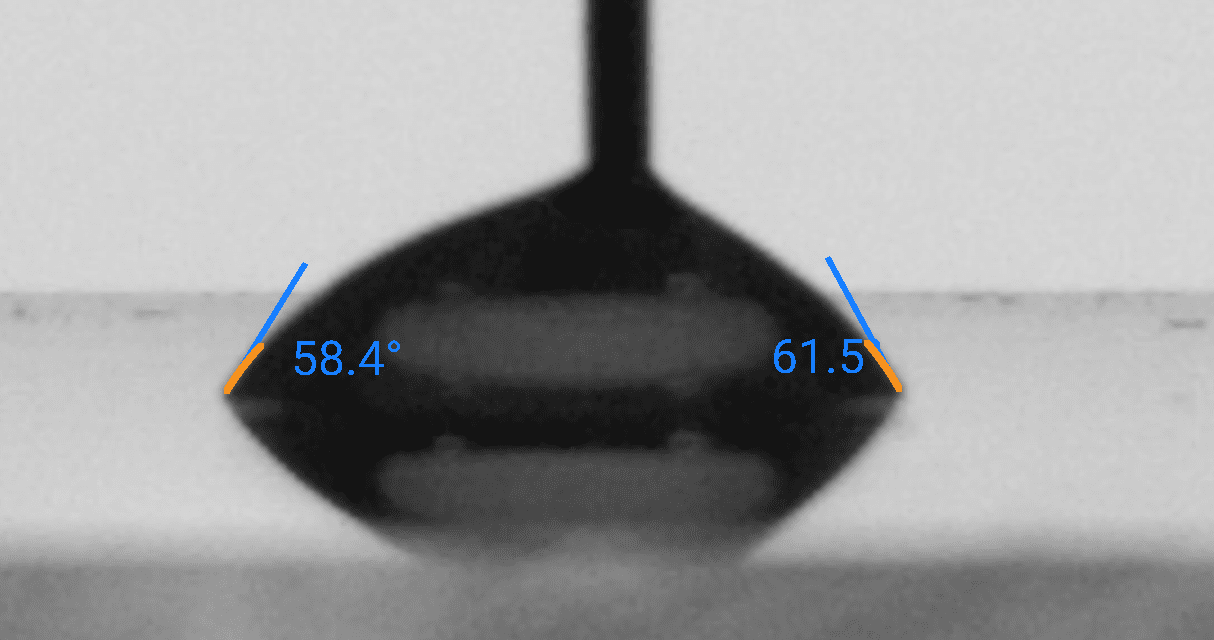
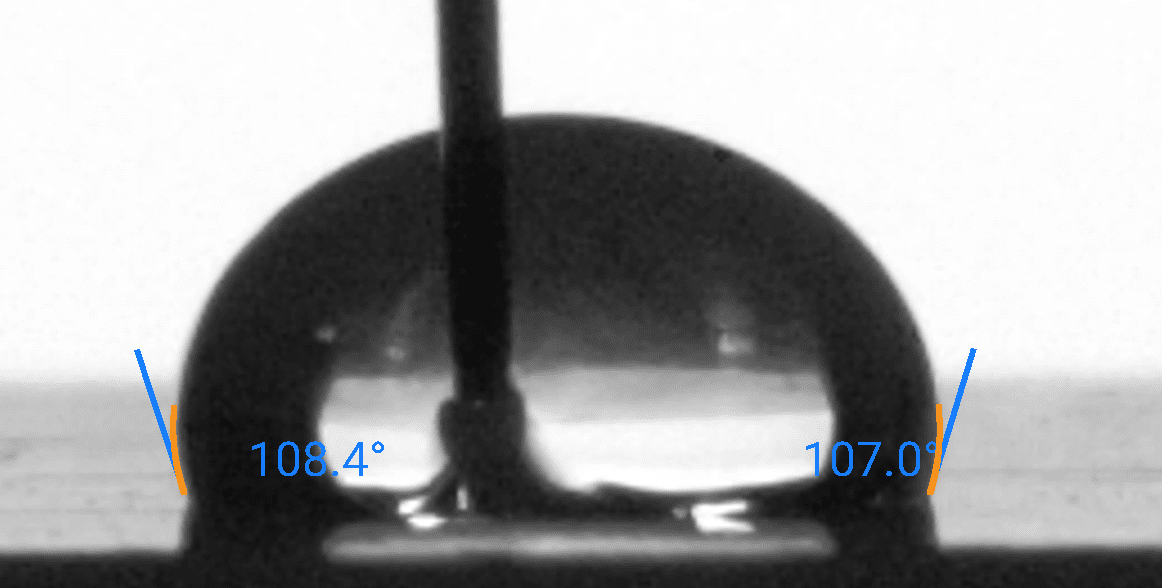
The droplet images above are taken from the same benchmark series as our open dataset. For each substrate and probe liquid we report:

● Advancing and receding contact angles (and hysteresis)
● Derived surface energy (SFE) values based on multi-liquid measurements
● Measurement conditions, uncertainties, and sample preparation details

Comparing your own droplet shapes and angles against these references is a fast way to spot contamination, treatment drift, or unexpected changes in wettability.

Chapter 3: Surface Tension Measurement

This property measures the force that acts on the surface of a liquid, aiming to minimize its surface area.

Surface Tension Measurement

Sample Image taken from Droplet Lab Tensiometer

Dynamic Surface Tension

Dynamic surface tension differs from static surface tension, which refers to the surface energy per unit area (or force acting per unit length along the edge of a liquid surface).

Static surface tension characterizes the equilibrium state of the liquid interface, while dynamic surface tension accounts for the kinetics of changes at the interface. These changes could involve the presence of surfactants, additives, or variations in temperature, pressure, and composition at the interface.

When to use Dynamic Surface Tension Measurement

Dynamic surface tension is essential for processes that involve rapid changes at the liquid-gas or liquid-liquid interface, such as droplet and bubble formation, coalescence (change in surface area), the behavior of foams, and the drying of paints (change in composition, e.g., evaporation of solvent). It is measured by analyzing the shape of a hanging droplet over time.

Dynamic surface tension applies to various industries, including cosmetics, coatings, pharmaceuticals, paint, food and beverage, and industrial processes, where understanding and controlling the behavior of liquid interfaces is essential for product quality and process efficiency.

Learn how Surface Tension measurement is done on our Tensiometer

For a more complete understanding of Surface Energy measurement, read our Surface Tension measurement: The Definitive Guide

Chapter 4: Surface Energy Measurement

Surface energy refers to the energy required to create a unit area of a new surface.
231

Sample Image taken from Droplet Lab Tensiometer

Learn how Surface Energy measurement is done on our Tensiometer

For a more complete understanding of Surface Energy measurement, read our Surface Energy measurement: The Definitive Guide

For benchmark contact angle and surface energy values on glass, nylon, PMMA, and Teflon, see the Open Benchmark Data panel above or visit our Dataset Hub for full CSV downloads.

Chapter 5: Sliding Angle Measurement

The sliding angle measures the angle at which a liquid film slides over a solid surface. It is commonly employed to assess the slip resistance of a surface.

sliding angle 1

Sample Image taken from Droplet Lab Tensiometer

Learn how Sliding Angle measurement is done on our Tensiometer

For a more complete understanding of Sliding Angle measurement, read our Sliding Angle Measurement: The Definitive Guide

Chapter 6: Real-World Applications

Within the Transportation industry, several case studies exemplify the advantages of conducting surface property measurements.

Ice Accumulation on Aircraft Wings

To combat the dangerous threat of ice buildup on aircraft wings, coatings are being developed with a dual purpose: anti-icing and de-icing. These coatings must effectively repel water droplets, prevent ice formation from both vapor and liquid states, and most importantly, significantly reduce ice adhesion once it forms. Measuring the contact angle and sliding angle becomes crucial in evaluating the effectiveness of superhydrophobic coatings for de-icing. By designing ice-phobic coatings with a low sliding angle, we can prevent ice from sticking and facilitate its easy removal, ultimately saving time and resources during deicing procedures.

Ice Accumulation on Aircraft Wings

Anti-adhesive Surfaces with Low Wettability on Titanium Alloys

Despite their excellent mechanical and thermal properties, titanium alloys used in aerospace and automotive transportation suffer from low adhesion and corrosion. To address this challenge, we can create low-wetting surfaces on the alloy substrate. Anodization, for example, can be used on Ti6Al4V alloy to achieve a remarkable water contact angle of 158° and a sliding angle of 5.3°, creating a highly anti-adhesive surface. Alternatively, a combination of sandblasting and a hydrothermal method can be employed to prepare micro–nanoscale hierarchical structures on Ti6Al4V alloys. This method further improves the water contact angle to 161° and the sliding angle to a mere 3°, significantly enhancing the anti-adhesive properties.

Anti-adhesive Surfaces with Low Wettability on Titanium Alloys

We are your partners in solving your Business & Technological challenges

If you are interested in implementing these or any other applications, please contact us.

Chapter 7: Standards and Guidelines

In an industry where precision reigns supreme, how can Transportation manufacturers ensure their products withstand scrutiny? The answer lies in standards and guidelines: the compass that guides them through the complex maze of quality and performance.

ISO 19403-6:2024 — Dynamic Contact Angle (Advancing/Receding) by Drop-Volume Change

What it is

ISO 19403-6 specifies an optical sessile-drop method to measure dynamic advancing (θₐ) and dynamic receding (θᵣ) contact angles by increasing and decreasing droplet volume. It’s used to quantify wetting/dewetting behavior and contact-angle hysteresis (Δθ = θₐ − θᵣ) to help diagnose surface heterogeneity, contamination, or pretreatment drift on coated panels and substrates.

When to use it

Ready-to-coat / ready-to-bond verification:

Use dynamic θₐ/θᵣ (not just static angle) when you need early indication that surfaces will wet and resist dewetting before applying transportation coatings, adhesives, or sealants.

Root-cause triage & process drift monitoring

Use θₐ/θᵣ/Δθ trends and variability to separate likely chemistry/contamination drift from texture/heterogeneity/pinning effects when defects (e.g., fisheyes/craters, adhesion loss) start rising.

In-scope / Out-of-scope

In scope
  • Sessile-drop optical measurement with controlled volume increase/decrease (e.g., needle-in-drop dosing) to obtain dynamic angles.
  • Dynamic advancing (θₐ) during volume increase and dynamic receding (θᵣ) during volume decrease under a defined volume-change program.
  • Derived hysteresis (Δθ = θₐ − θᵣ) and spot-to-spot variability as diagnostic outputs for non-uniform surfaces.
  • Coated panels/substrates (common in transportation finishing and bonding workflows) using a documented SOP to lock controllables.
Out of scope
  • Universal pass/fail thresholds (limits must be calibrated to your downstream outcomes for each coating family + substrate + pretreatment).
  • Surface energy component analysis or direct liquid surface tension measurement (use other standards/methods for those).
  • Uncontrolled porous/absorbing surfaces where absorption dominates the droplet-volume/contact-line behavior without additional controls.
  • Alternative contact-angle methods (e.g., tilting plate, captive bubble, Wilhelmy) and replacing your instrument’s operating instructions.

Minimum you must report (checklist)

  • Standard + edition used (ISO 19403-6:2024) and your internal SOP ID (if applicable).
  • Substrate/coating description (material, finish) and pretreatment/treatment history, including time since treatment/cure.
  • Test liquid (identity, grade/concentration if relevant) and liquid temperature.
  • Drop/dosing geometry: sessile configuration, needle-in-drop (if used), needle type/size, and imaging/optics setup.
  • Volume-change program: start volume, step size or continuous rate, advance/recede rate, and dwell/settling rule.
  • Results: θₐ, θᵣ, and Δθ = θₐ − θᵣ, plus number of spots/replicates.
  • Statistics across spots: median + IQR (or mean + SD) and spot rejection/re-run criteria (edge fit QC, non-axisymmetric drops, vibration, unstable receding due to pinning).
  • Environment + controls: temperature/RH (if controlled) and reference (“golden”) panel or other run control results.

Dynamic contact angles are method-dependent, so your SOP must lock needle geometry, dosing rate, dwell, leveling, and fit/QC rules to keep trends comparable. If you see “ISO 19403-6:2023” internally, it commonly refers to a draft/DIS stage; the published ISO edition is 2024.

How to interpret results (guardrails)

  • θₐ increases vs baseline → poorer initial wetting; investigate treatment decay, low-energy residues, or contamination before coating/bonding.
  • θᵣ decreases or becomes unstable and/or Δθ increases → stronger pinning/dewetting tendency consistent with heterogeneity, roughness, contamination, or cure gradients; treat as a diagnostic signal, not a single-cause verdict.
  • High spot-to-spot variability (large IQR/SD) → non-uniform pretreatment/coating/additive distribution or localized contamination; use a panel map to locate outliers.
  • Always anchor interpretation to controls (golden panel stability) and calibrate Green/Yellow/Red limits to downstream metrics (adhesion, crater/fisheye rate, rework/scrap) for each process window.

Now It’s Your Turn

We hope this guide showed you how to apply surface science in the Transportation industry.

Now we’d like to turn it over to you: 

Feel free to leave a comment below—we’d love to hear from you.

Leave a Reply

Your email address will not be published. Required fields are marked *


Download Experiment