15–20%
of annual revenue consumed by Cost of Poor Quality in typical manufacturing operations
American Society for Quality

Catch powder condition drift, moisture pickup, oxidation, and contamination before they show up as recoater streaks, bare spots, or build defects, by screening powder surface behavior before it reaches the bed.
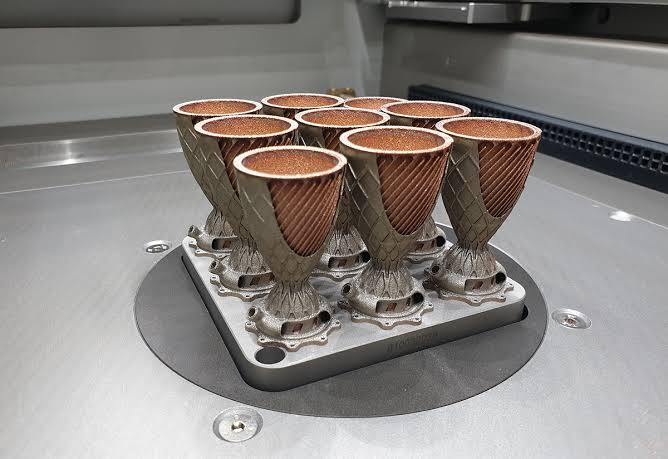
Who this is for: Process engineers and QA/QC teams in powder bed fusion additive manufacturing (laser, electron beam, and polymer systems).
Positioning: Dropometer does not replace powder characterization equipment (particle size analysis, flowability testers) or in-situ layer monitoring. It adds a fast, quantitative wetting and surface energy screen for powder condition, catching moisture, oxidation, or contamination drift before it disrupts powder bed formation.
Droplet Lab builds precision instruments and software for surface science measurement, specialising in contact angle analysis and surface tension characterisation. Used by researchers across materials science, pharmaceuticals, coatings, and advanced manufacturing, Droplet Lab's Dropometer has contributed to studies published in peer-reviewed journals including Advanced Functional Materials (Impact Factor 19). The team combines instrument engineering with deep domain knowledge in wettability science with a focus on practical accuracy.
of annual revenue consumed by Cost of Poor Quality in typical manufacturing operations
American Society for Quality
higher hidden cost vs. visible scrap cost: rework, re-inspection, downtime, and warranty claims are rarely captured
Lean Six Sigma research consensus
upstream prevention typically saves $10 in internal rework and up to $100 in external warranty and recall costs, for the specific failure modes an upstream screen actually catches
COPQ prevention-to-failure ratio
Sources: ASQ, Learn Lean Sigma, Fabrico COPQ Guide 2026. Figures are industry-wide benchmarks, not Droplet Lab claims. On this page specifically, this instrument screens moisture, oxidation, and organic-contamination drift on the powder surface well; it does not measure particle size distribution, morphology, or recoater/spreading mechanics directly, both are documented root causes of powder bed defects that require separate diagnostic equipment.
Quick technical reference for AM process engineers and QA managers evaluating fit before reading further.
Powder spreading instability, recoater streaks, bare spots, inconsistent layer thickness, and poor powder bed density, often caused by subtle changes in powder surface condition (moisture, oxidation, contamination) that are invisible to a visual inspection.
Contact angle, static, advancing, and receding, on the powder surface
Surface energy trend data for the powder material
Tilting-plate droplet behavior for pinning and adhesion signal
Pendant drop surface tension, where a liquid-phase measurement is relevant
Contact angle (static/advancing/receding) for powder wetting trends
Surface energy (trend-based via Equation of State, Fowkes, Oss & Good)
Tilting plate droplet behavior (0°–60°)
Optional pendant-drop surface tension measurements
Correlate PASS/MONITOR/FAIL thresholds to your own powder bed density, defect rate, and spreading quality outcomes, not a generic published value.
DI water as the probe liquid for powder surface testing
Fixed droplet volume, down to the instrument's automatic dosing floor
Fixed capture time
Replicate-based statistics (median plus IQR) per zone
Apparent contact angle on a powder bed is influenced by surface roughness and liquid imbibition into the pore structure, not a true equilibrium reading. Wetting is a drift-detection signal, not a direct proxy for powder spreading quality, particle size distribution, or morphology.
The Dropometer serves four roles across a powder bed fusion QC program. Each has a different primary risk.
Fighting recoater streaks, bare spots, or inconsistent layer thickness, and needing to know whether the powder condition or the spreading mechanics are responsible.
Tracking oxidation and surface chemistry drift across powder reuse cycles, and needing a numeric basis for when a reused powder lot should be retired.
Needing a numeric incoming-material gate on powder batches to catch moisture or contamination drift before it reaches the build chamber.
Requiring documented, defensible evidence of powder batch qualification for NCR responses, CAPA files, or supplier audits.
This is not a universal solution. Check the conditions below before investing further time.
Even in-spec powder can degrade in ways a visual check won't catch, until it shows up as a recoater streak or a build defect.
Stable powder beds are essential to powder bed fusion additive manufacturing. Powder spreading instability often stems from subtle, seemingly random shifts in material condition, moisture pickup, oxidation, or organic contamination, that affect flow and particle cohesion. Powder that's still within its nominal specification can degrade in ways a visual inspection won't catch until it shows up as a recoater streak, a bare spot, or a build defect.
It's worth being precise about what this actually screens. Moisture adsorption, oxidation and surface chemistry drift from powder reuse, and organic contamination are all wetting-driven and screen well with this instrument. Powder size distribution and morphology are separate, real root causes of the same defects (streaks, bare spots, density variability), measured by particle size analysis and flowability testing, not by contact angle. Recoater and spreading-parameter drift (blade condition, roller condition, spreading speed) is a third, independent, mechanical cause: stable wetting readings with degraded powder bed quality point there, not back to the powder's surface condition.
Used on the failure modes it actually covers, this workflow catches a powder condition drift before it becomes a bed-formation problem, rather than diagnosing it after a defective build.
Powder that passed incoming inspection still produces recoater streaks, bare spots, or inconsistent build results, without a quantitative pre-build way to tell whether the powder's surface condition or the spreading mechanics are responsible.
Why:
How to detect:
Corrective action:
Why:
How to detect:
Corrective action:
Why:
How to detect:
Corrective action:
Improve handling protocols and clean powder-contact surfaces on a defined scheduleWhy:
How to detect:
Corrective action:
Why:
How to detect:
Corrective action:
A surface science specialist can review your build failure history and help you identify whether a surface screen would add a useful upstream gate.
Surface readiness measurement produces the type of numeric, traceable output that a subjective visual check of a powder lot cannot. If your quality system requires documented evidence of process control for NCR responses, CAPA files, incoming inspection records, or supplier audits, contact angle and surface energy data provide that evidence in a format your QA documentation already requires.
Numeric contact angle, surface energy, and variability values with replicate spread, timestamps, and powder lot and reuse-cycle identification; replacing subjective "the powder looked fine" notes with defensible numeric logs.
When a recoater streak, bare spot, or build-defect event triggers a Corrective and Preventive Action file, wetting data from before and after a powder lot or reuse-cycle change provide quantitative evidence of the mechanism involved, not anecdotal description.
Non-conformance reports that include numeric wetting data allow you to assign root cause to moisture, oxidation, or contamination with evidence, not inference, and to rule those causes out when the real cause is particle size distribution or recoater mechanics.
Incoming powder lot inspection using contact angle and surface energy provides a numeric acceptance criterion for supplier qualification, independent of the supplier's own certificate of analysis.
Powder surface trend logs by reuse cycle demonstrate statistical process control at the incoming and pre-build step; relevant to Six Sigma, SPC, and DMAIC programs targeting defect-driven COPQ.
A pre-build wetting check on a new powder lot or a reused powder batch gives materials engineering a numeric basis for release or retirement, instead of finding out about a degraded lot only after a defective build.
Why it matters: Indicates powder surface wetting behavior and detects moisture, oxidation, or contamination drift.
How to interpret: Compare against your own dry, unreused baseline rather than a generic threshold.
When it is not enough: Requires controlled, standardized powder presentation for a comparable reading; not a direct measurement of spreading quality itself.
Why it matters: Detects non-uniform powder condition that a single-point reading would miss.
How to interpret: High variability relative to baseline signals an unstable or inconsistent powder bed condition worth investigating.
When it is not enough: Needs complementary diagnostics (particle size analysis, recoater inspection) to confirm which root cause is responsible.
Why it matters: Indicates droplet adhesion and pinning behavior on the powder surface.
How to interpret: Compare pinning and roll-off trends against baseline rather than treating any single reading as absolute.
When it is not enough: Sensitive to surface roughness; most useful as a comparative, not absolute, signal.
Why it matters: Reflects powder surface state changes, particularly oxidation, across reuse cycles.
How to interpret: Track the trend against reuse-cycle count rather than a single absolute number.
When it is not enough: Not a direct predictor of spreading quality on its own; correlate against your own bed-formation outcomes.
Independent benchmarking and publication-based validation references.
Benchmark Validation
Dropometer contact angle and pendant-drop surface tension methods have been benchmarked against KRÜSS DSA100E reference measurements. The instrument is referenced in peer-reviewed journals including Bioactive Materials (Impact Factor 20) and Advanced Functional Materials (Impact Factor 19).
See peer-reviewed validationPublication Evidence
Our instruments are referenced in peer-reviewed journals, theses, and conference publications.
Browse citationsDropometer is best used as an incoming-material gate on powder lots and a reuse-cycle tracking tool, with a rule-out workflow for isolating powder-condition from spreading-mechanics causes when a build fails.
Define known-good powder bed characteristics per material, on fresh, unreused powder: This baseline is what every future lot and reuse cycle gets compared to
Screen feedstock before powder bed fusion use, including tracking reuse-cycle count: Gate materials against your baseline rather than a vendor certificate alone
Identify whether a defect stems from powder condition or spreading parameters: Rule out powder wetting first, since it's the fastest to check, before touching recoater mechanics
Link wetting data to your own bed density, spreading quality, and build success rate: This calibration is what turns a wetting reading into a defensible PASS/MONITOR/FAIL gate
We completed our gage R&R study on the unit and it performed very well.
Brandon Barbee
Corporate Quality Engineer - Zeus Industries - Polymer Manufacturing
An editable SOP template your team can adapt for your powder material and process. Includes measurement protocol, gate-setting guidance, and a QC log format ready for your documentation system.
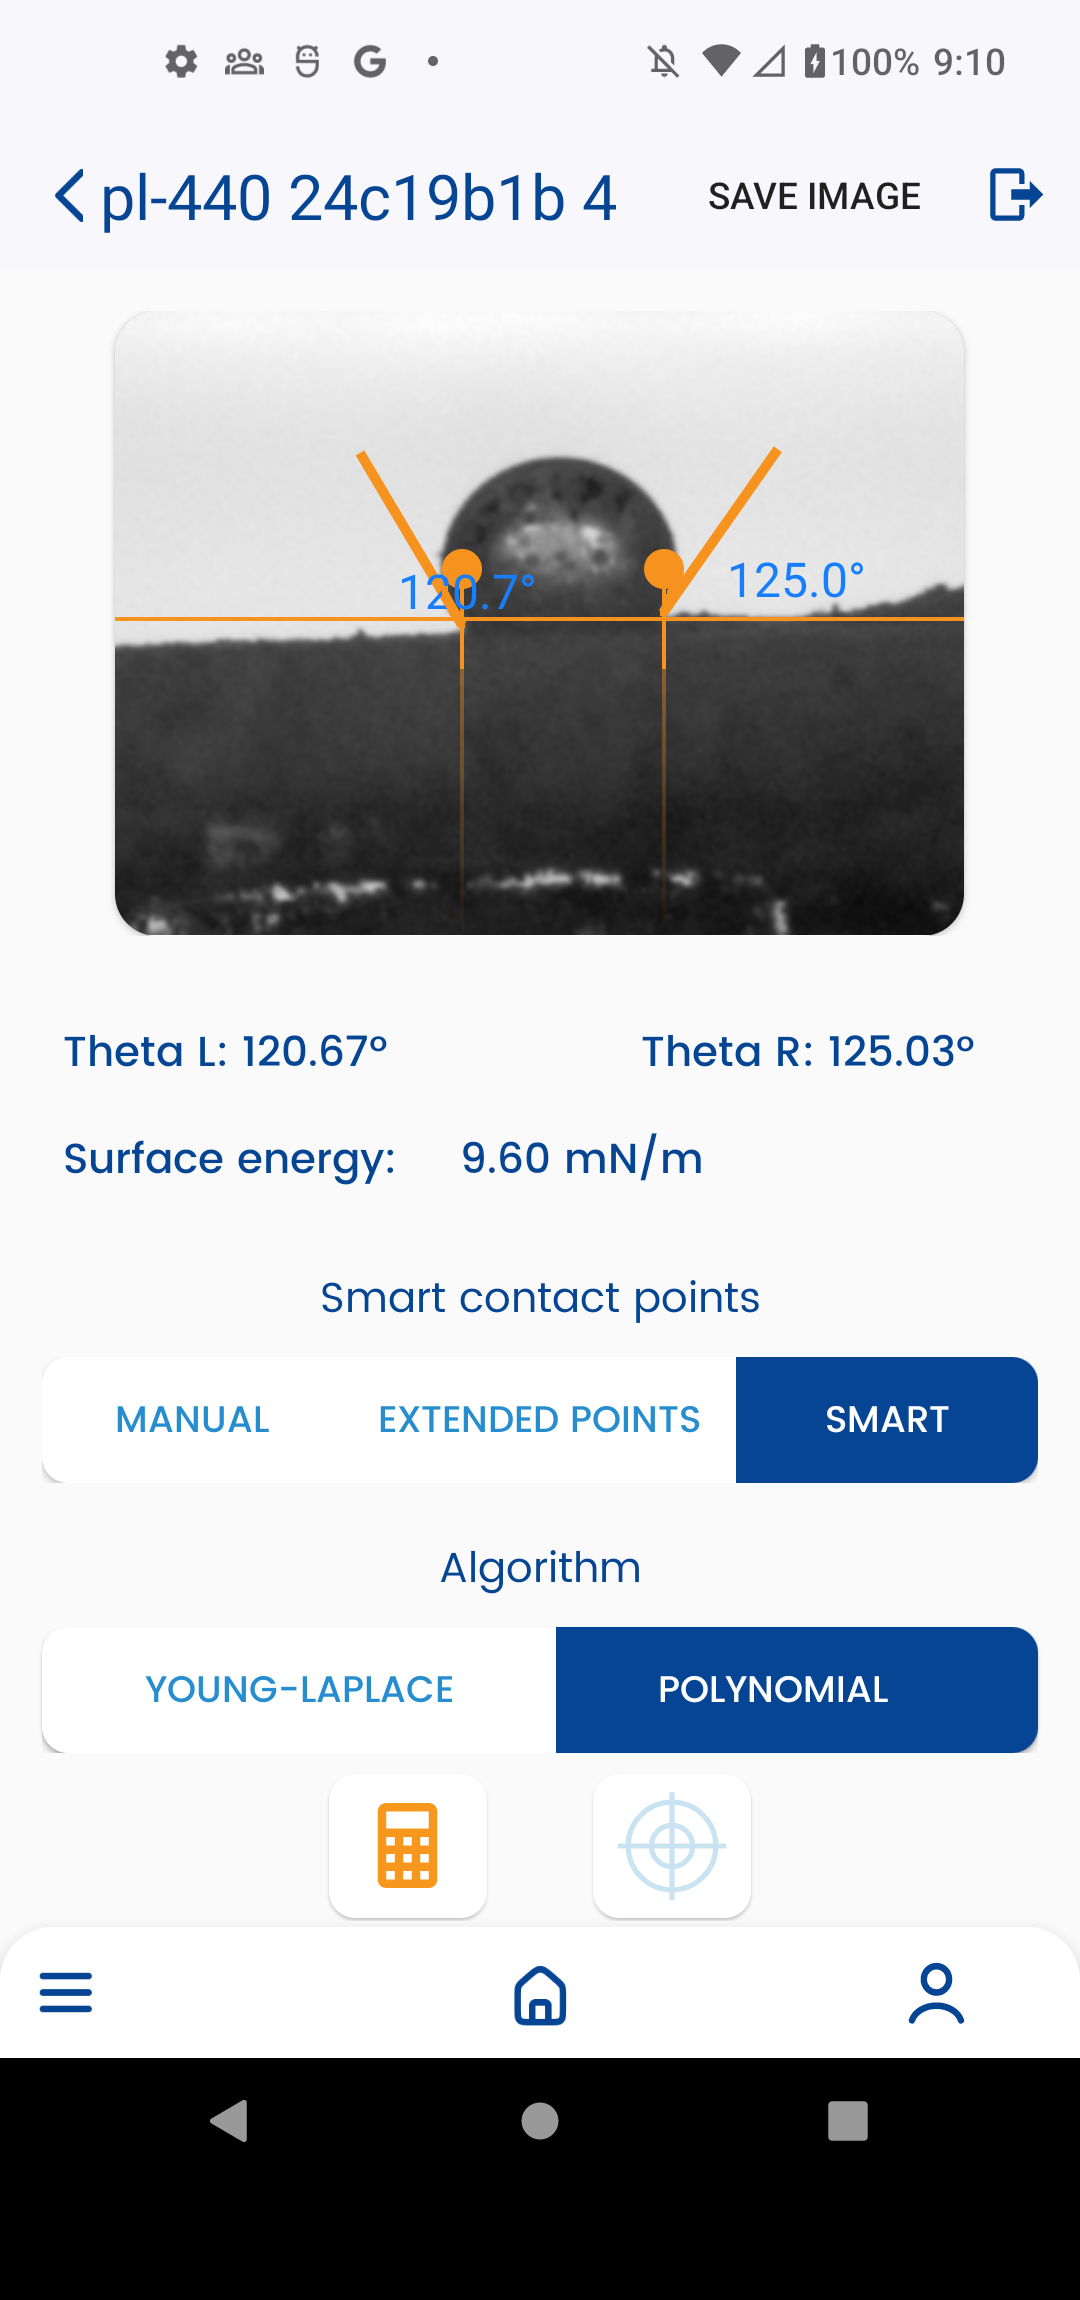
Representative output format. Values are illustrative, not a universal specification.
Dropometer contact angle and surface energy measurement on a powder lot. This is the type of output used to decide whether a powder lot proceeds to the next build or gets retired.
| Sample | Contact Angle (°) | Variability (Zone-to-Zone) | Release Decision |
|---|---|---|---|
| Powder lot, fresh, unreused (baseline) | 61° | Low | PASS |
| Powder lot, reuse cycle 5 | 74° | Low-Moderate | PASS — continue tracking trend |
| Powder lot, reuse cycle 12 | 92° | Moderate | MONITOR — confirm bed density before next build |
| Powder lot, visible moisture exposure | 108° | High | FAIL — dry or reject lot |
The fresh, unreused powder establishes the PASS baseline. Reuse cycle 5 shows a modest contact-angle rise consistent with early oxidation, still within a reasonable PASS range but worth tracking as a trend rather than a one-time reading. Reuse cycle 12 shows a larger shift and moderate variability, the MONITOR threshold this workflow is built to catch before a degraded lot reaches a full build. The moisture-exposed lot shows both a high contact angle and high variability together, a combination worth a FAIL decision pending drying or rejection. This output would be included in the powder qualification record used to decide whether a lot proceeds or is retired.
Simple checklist for pre-bond release gating
Goal: Prevent adhesive failure before bonding by screening surface readiness and triggering corrective actions before assembly.
Start condition: recoater streaks, bare spots, layer thickness variability, or increased build defects are showing up. Use the signal pattern to identify the most likely cause.
Likely cause: Moisture adsorption increasing particle cohesion.
Action: Dry the feedstock and control storage humidity on a measured schedule.
Likely cause: Oxidation and surface chemistry drift from repeated powder reuse.
Action: Track reuse cycles per lot and separate powder by exposure history.
Likely cause: Organic contamination from oils or handling residue.
Action: Improve handling protocols and clean powder-contact surfaces on a defined schedule.
Likely cause: Particle size distribution or morphology change, a separate cause requiring PSD instrumentation to confirm.
Action: Standardize sieving and control particle size distribution using dedicated PSD tools.
Likely cause: Recoater or spreading-parameter drift (blade condition, roller condition, spreading speed), a mechanical issue, not a wetting one.
Action: Adjust spreading parameters and inspect the recoater system mechanically.
No. It measures wetting and surface energy, which drift-detects moisture, oxidation, and contamination, factors documented to affect spreadability. It's a correlated screen, not a direct spreadability measurement; treat it as an early-warning signal, not a spreadability test replacement.
No. Particle size distribution and morphology are measured by laser diffraction, sieving, or image analysis, separate instrumentation from this one. This screen rules powder surface condition in or out as a cause; it doesn't characterize particle size.
Measure surface energy and contact angle on a sample from each reuse cycle and track the trend against your fresh-powder baseline. A defined threshold on that trend gives you a numeric basis for retiring a lot instead of a subjective judgment call.
It rules out powder surface condition as the cause, pointing the investigation toward particle size distribution, morphology, or recoater and spreading mechanics instead.
Yes. Moisture adsorption increases particle cohesion through capillary forces even in an otherwise in-spec powder, this is a documented root cause, not a hypothetical one.
Yes. Comparing contact angle and surface energy against your existing baseline is a reasonable first screen before a full particle-size and build-trial qualification.
Yes. The Dropometer produces numeric contact angle, surface energy, and variability data with replicate records, timestamps, and lot/reuse-cycle identification, usable in NCR responses, CAPA files, and supplier audit packages.
| Metric | Before Dropometer | With Dropometer | Indicative Benchmark |
|---|---|---|---|
| Failure discovery point | A defective build, after committing powder and machine time | Contact angle and surface energy screening before the build starts | "COPQ from late-discovered defects typically 15–20% of revenue for manufacturers without upstream gates" |
| Powder reuse decisions | Fixed reuse-cycle limit regardless of actual powder condition | Measured surface energy trend by reuse cycle triggers retirement when it's actually needed | "Reduces both premature material waste and missed-drift failures" |
| Incoming material qualification | Vendor certificate of analysis only | Numeric wetting gate on incoming powder lots | "Reduces reliance on supplier-reported values alone" |
| Failure diagnosis | Trial-and-error across powder, particle size, and recoater settings | Rule-out logic isolates whether the cause is surface-condition-related before touching mechanical variables | "Structured diagnosis vs. guess-and-check troubleshooting" |
| Audit documentation | Subjective visual powder check; not defensible under audit | Numeric wetting logs with timestamps and lot/reuse-cycle ID | "Applicable to NCR, CAPA, incoming inspection, and supplier qualification records" |
Powder Bed Fusion ROI Snapshot
Result
Monthly savings = preventable rework cost + preventable scrap cost + other monthly savings.
Knowing the limits of any measurement tool is part of using it responsibly.
Use this page to improve powder qualification and upstream troubleshooting, not to replace particle size analysis or in-situ layer monitoring. The Dropometer is one layer in a quality system, not a substitute for one.
A related additive manufacturing pre-print screening workflow, sharing the same production-scrap ROI shape and powder-surface diagnostic approach.
A related additive manufacturing pre-print screening workflow, using the same wetting-based diagnostic logic on a different AM process.
The general contamination-screening methodology this page's organic-contamination root cause depends on.
Editorial and technical transparency notes for this page.
Initial draft created with AI assistance (Claude 4.8 Opus Pro), then rewritten for technical clarity by Droplet Lab Staff
Technical review and editing by a surface-science specialist for accuracy
Identifiers, units, thresholds, and key claims checked against cited sources before publication
Reviewed every 12 months or when underlying standards or instrument specifications change
Spotted an issue in this summary? Send a correction request and our team will review it.
Correction Request
We work hard to keep this standards summary accurate and up to date. If you spot an error (wrong revision/year, missing requirement, incorrect interpretation, or broken link), tell us and we'll review it.
Contact us to report a correction