Contents
Sealant Application & Durability QC

Silicone Sealant Application QC: Quantitative Beading and Waterproof Verification

Stop inconsistent sealant performance, early hydrophobicity loss, and anti-soiling failures by adding fast, quantitative wetting gates to your sealant application workflow.

Who this is for: Process engineers, QA/QC teams, applicators, and manufacturing leads responsible for silicone sealant, sealant application, and long-term waterproof durability in construction projects and industrial environments.

Positioning: Dropometer strengthens your sealant application QC process. It does not replace a leak test or your bond-strength acceptance criteria — it adds a fast, quantitative wetting screen that flags a sealant bead unlikely to hold up before it's signed off.

Last updated
July 12, 2026
Gurdeep-Saini-Photo
Written by
Gurdeep Singh Saini
Holds a BASc in Mechanical Engineering (Ryerson) and an MASc from York University. He focuses on the custom AI behind the instrument.
COO at Droplet Lab
Read More
Droplet-Lab logo
Technical Review by
Droplet Lab Team
Droplet Lab builds precision instruments and software for surface science measurement, specialising in contact angle analysis and surface tension characterisation. Used by researchers across materials science, pharmaceuticals, coatings, and advanced manufacturing, Droplet Lab's Dropometer has contributed to studies published in peer-reviewed journals including Advanced Functional Materials (Impact Factor 19). The team combines instrument engineering with deep domain knowledge in wettability science with a focus on practical accuracy.
Read More
Gurdeep-Saini-Photo
Written By

Gurdeep Singh Saini

COO at Droplet Lab

Holds a BASc in Mechanical Engineering (Ryerson) and an MASc from York University. He focuses on the custom AI behind the instrument.

Droplet-Lab logo
Reviewed By

Droplet Lab Team

Droplet Lab builds precision instruments and software for surface science measurement, specialising in contact angle analysis and surface tension characterisation. Used by researchers across materials science, pharmaceuticals, coatings, and advanced manufacturing, Droplet Lab's Dropometer has contributed to studies published in peer-reviewed journals including Advanced Functional Materials (Impact Factor 19). The team combines instrument engineering with deep domain knowledge in wettability science with a focus on practical accuracy.

The Cost Of Getting It Wrong

15–20%

of annual revenue consumed by Cost of Poor Quality in typical manufacturing operations

American Society for Quality

10×

higher hidden cost vs. visible scrap cost: rework, re-inspection, downtime, and warranty claims are rarely captured

Lean Six Sigma research consensus

$1 → $10

upstream prevention typically saves $10 in internal rework and up to $100 in external warranty and recall costs, for the specific failure modes an upstream screen actually catches

COPQ prevention-to-failure ratio

ASQ, Learn Lean Sigma, Fabrico COPQ Guide 2026. Figures are industry-wide benchmarks, not Droplet Lab claims. On this page specifically, the $10-$100 multiplier maps directly onto a real, common cost: a callback to re-do a sealant job on site, versus catching a bad bead before the crew leaves.

QC-Ready Summary

What this workflow does and what it does not

Quick technical reference for engineers and QA managers evaluating fit before reading further.

Evidence Box (QC-Ready)

Problem this solves

A silicone sealant bead that looks perfect visually but still fails in real-world waterproof performance, leading to leaks, streaking, or poor adhesion discovered after the crew has already left the job.

Dropometer role in workflow

Post-cure sealant bead verification (beading and uniformity), troubleshooting inconsistent application, and durability checks after cleaning, UV, or abrasion exposure. Not a replacement for a leak test or bond-strength acceptance criteria.

Primary outputs

Water contact angle at a fixed time after cure
Tilt behavior across the instrument's tilt range for droplet movement and pinning
Spot-to-spot variability across bead zones (IQR/SD)
Optional surface energy estimation
Optional liquid surface tension check for sealant formulation QC

Calibration requirement

Define PASS / MONITOR / FAIL gates by correlating wetting metrics to your own leak tests, field complaints, rework rates, and durability outcomes; not a generic published threshold.

Protocol defaults

Probe liquid: DI water
Fixed droplet volume and fixed capture time
Minimum 5 replicates per zone
Re-run any unstable droplet reading rather than accepting it

Known limitation

Good wetting behavior does not guarantee a fully waterproof seal or confirmed adhesion. Rough or soft sealant surfaces increase variability, tilt measurement is limited to the instrument's tilt range, and fast pinning/release events can exceed the camera's frame rate.

Who this is for

What are you trying to solve?

The Dropometer serves four roles across a silicone sealant application program. Each has a different primary risk. Jump to yours.

Process Engineer / Applicator Lead

Investigating inconsistent sealant bead quality across crews or jobs with no clear root cause, especially after a change in surface prep or sealant product.

Unexplained process drift

QA / QC Manager

Needing a numeric sign-off gate before crews leave the job site to reduce callbacks and rework tied to sealant failures.

Callback and rework cost

Compliance Officer

Requiring documented, defensible evidence of sealant application quality for NCR responses, CAPA files, or client audits.

Audit non-conformance

Applicator / Field Technician

Wanting a fast, objective way to confirm a bead is done correctly before moving to the next joint or leaving the site.

Operator-to-operator variability
workflow fit

Is this the right screen for your process?

This is not a universal solution. Check the conditions below before investing further time.

Good fit if

Sealant beads that look visually fine still fail at leak testing or in the field
You need a numeric sign-off gate before a crew leaves the job site or moves to the next joint
You need to distinguish cure drift, contamination, application technique, or sealant selection as the cause of a failure
Your QA or compliance process requires a traceable sealant application record
You track durability degradation from UV, cleaning chemicals, or abrasion over the sealant's service life

Less relevant if

Your acceptance test is purely a field leak test with no appetite to add an upstream wetting gate
Your sealant failures are confirmed to trace back to joint design or movement capability rather than surface wetting; see Honest Scope for why this instrument doesn't screen for that directly
You need definitive proof of full waterproof performance from a single reading; wetting behavior is a strong upstream indicator, not a substitute for a leak test
You have no repeatable way to fixture or measure the bead consistently across jobs, and no interest in building one
Root Cause Context

A Perfect-Looking Bead Isn't the Same as a Waterproof Seal

Sealant application quality isn't just about how the bead was applied — it's about whether the surface keeps behaving like a water-resistant surface over time.

A silicone sealant bead can look correctly applied and still fail in real-world waterproof performance, leading to leaks, streaking, or poor adhesion. The gap between "looks right" and "performs right" is usually one of five things: the sealant didn't fully cure, the surface was contaminated before application, the application technique itself was inconsistent, the wrong sealant type was chosen for the substrate, or the sealant's durability against UV, cleaning chemicals, or abrasion is degrading faster than expected.

A water contact angle and tilt-behavior check adds two things most sealant QC processes are missing: a numeric reading immediately after cure, instead of a visual judgment call, and a repeatable way to re-check durability after real-world stress instead of assuming the bead will hold indefinitely.

The honest limit: wetting behavior is a strong indicator, not a guarantee. Good wetting does not by itself confirm a fully waterproof seal or confirmed adhesion; this screen tells you which beads are worth trusting and which need a second look, using your own leak-test and field-complaint data to calibrate the gate, not a generic published threshold.

Recognition

What Does a Sealant Application Failure Actually Look Like?

Many teams sign off on a sealant job based on how it looks, only to find out later, after a leak or a callback, that the bead wasn't actually performing the way it appeared to.

Inconsistent sealant bead formation across jobs using the same nominal product and procedure.
Water sheeting across the bead instead of beading up.
Loss of hydrophobicity after routine cleaning.
Streaking along edges or sealant lines.
Frequent need to reapply or remove and redo old sealant.
Disputes with clients or between crews based on visual inspection instead of data.
Diagnosis

Root Causes

Why:

  • Improper temperature or humidity, or insufficient cure time, prevents the sealant from fully curing even when the application looked correct.

How to detect:

  • Lower contact angle than expected Unstable droplet readings

Corrective action:

  • Standardize cure time against the product's specification Confirm surfaces are completely dry before application

Why:

  • Oils, dust, or solvent residue on the surface before application prevent proper adhesion and wetting.

How to detect:

  • High variability across spots on the same bead

Corrective action:

  • Clean the surface immediately before application Use gloves and avoid touching the fresh sealant

Why:

  • Uneven pressure, stopping and starting the bead, or incorrect application speed produces an inconsistent bead even with a good sealant and clean surface.

How to detect:

  • Mixed wetting behavior along the length of the bead

Corrective action:

Hold the gun steady and maintain consistent pressure and speed along the full joint

Why:

  • Using an incorrect silicone type for the substrate (glass, metal, or otherwise) can look fine on application and still adhere poorly.

How to detect:

  • Poor adhesion of the new sealant despite correct application technique

Corrective action:

  • Select the sealant type specified for the actual substrate rather than a general-purpose default

Why:

  • UV exposure, cleaning chemicals, and abrasion reduce a sealant's hydrophobic and anti-soiling performance over its service life.

How to detect:

  • Increased droplet pinning after exposure, compared to the post-cure baseline

Corrective action:

  • Improve formulation durability or adjust cleaning protocols to reduce chemical exposure

Not sure which root cause applies to your process?

A surface science specialist can review your callback history and help you identify whether a sealant screen would add a useful sign-off gate.

For Compliance Officers and QA Managers

Building a defensible sealant application record

Surface readiness measurement produces the type of numeric, traceable output that a subjective visual check cannot. If your quality system requires documented evidence of process control for NCR responses, CAPA files, or client audits, contact angle and tilt-behavior measurement provide that evidence in a format your QA documentation already requires.

Audit trail

Numeric contact angle and tilt-behavior values with replicate spread, timestamps, applicator records, and job/lot identification; replacing subjective "bead looks fine" notes with defensible numeric logs.

CAPA evidence

When a sealant failure triggers a Corrective and Preventive Action file, contact-angle and tilt data provide quantitative before/after evidence of bead condition, not anecdotal descriptions.

NCR documentation

Non-conformance reports that include numeric wetting data allow you to assign root cause to cure, contamination, technique, or sealant selection with evidence, not inference.

Client sign-off

A numeric sign-off record gives clients or general contractors defensible evidence of application quality at the time of job completion, rather than relying on a visual walkthrough alone.

Process control records

Contact-angle and tilt trend logs demonstrate statistical process control at the application step; relevant to Six Sigma, SPC, and DMAIC programs targeting callback-driven COPQ.

Durability monitoring record

Re-checking contact angle and tilt behavior after UV, cleaning, or abrasion exposure builds a durability record that can inform maintenance or re-application intervals.

What to Measure

Primary screen

Water Contact Angle

Why it matters: Indicates waterproof beading quality immediately after cure.

How to interpret: Higher angle generally indicates better hydrophobicity, relative to your known-good baseline.

When it is not enough: Does not by itself confirm a fully waterproof seal.

Primary screen

Variability (IQR/SD)

Why it matters: Detects inconsistent sealant application along the bead.

How to interpret: High spread indicates uneven coverage or technique.

When it is not enough: Doesn't identify which of the five root causes is responsible.

Diagnostic

Advancing/Receding Angles

Why it matters: Indicates droplet stickiness, important for anti-soiling performance over the sealant's service life.

How to interpret: Higher hysteresis suggests the bead will trap dirt and water rather than shedding it.

When it is not enough: A lab-scale indicator, not a substitute for real-world soiling exposure.

Primary screen

Tilt Behavior

Why it matters: Confirms whether water actually rolls off the bead, catching pinning that a static reading alone can miss.

How to interpret: Failure to roll off even at the top of the instrument's tilt range indicates poor real-world performance.

When it is not enough: Tilt measurement is limited to the instrument's tilt range.

Diagnostic

Surface Energy

Why it matters: Tracks contamination or formulation changes over time.

How to interpret: Use as a comparative trend between jobs or lots, not an absolute cross-lab number.

When it is not enough: Diagnostic only, not a pass/fail metric on its own.

Validated Measurement Approach

Independent benchmarking and publication-based validation references.

Benchmark Validation

Dropometer contact angle and pendant-drop surface tension methods have been benchmarked against KRÜSS DSA100E reference measurements. The instrument is referenced in peer-reviewed journals including Bioactive Materials (Impact Factor 20) and Advanced Functional Materials (Impact Factor 19).

See peer-reviewed validation

Publication Evidence

Our instruments are referenced in peer-reviewed journals, theses, and conference publications.

Browse citations
QC Protocol

Applying and Verifying Silicone Sealant

This page combines correct sealant application technique with the Dropometer QC step that confirms it worked — steps 1 through 4 are application technique, step 5 is verification.

1

Prepare the surface

Remove old sealant, clean and dry surfaces completely, and mask edges for a clean line: This is also where the contamination root cause is most commonly introduced or avoided

2

Apply the sealant

Load the cartridge, cut the nozzle at a consistent angle, and apply with steady pressure at a consistent speed: Uneven pressure or stop-start application is the poor-technique root cause

3

Tool the bead and cure

Shape and remove excess sealant, remove masking tape before curing starts, and allow full cure per the product's time, temperature, and humidity specification: Insufficient or improper cure is the cure-drift root cause

4

Run post-application QC

Measure contact angle and tilt behavior at a fixed time after cure: PASS: within baseline band → sign off the job MONITOR: borderline result → repeat measurement, check cure time and conditions FAIL: out of band → troubleshoot before sign-off, using the Root Causes signal pattern Map bead zones (edges, centre) and document decision and values in the QC log

We completed our gage R&R study on the unit and it performed very well.

Brandon Barbee

Corporate Quality Engineer - Zeus Industries - Polymer Manufacturing

Download the Sealant Application QC SOP Template

An editable SOP template your team can adapt for your sealant product, substrate, and application method. Includes measurement protocol, gate-setting guidance, and a QC log format ready for your documentation system.

Example Outputs

Sample Sealant Bead QC Log: Multiple Zones, Same Joint

Representative output format. Values are illustrative, not a universal specification.

Actual measurement output

Dropometer contact angle measurement — DI water on Teflon, chosen as the closest available reference among the four options to a cured silicone sealant surface, since both are low-surface-energy elastomeric materials. Left contact angle and right contact angle shown with fitted tangent lines at each contact point and the baseline overlay. This is the type of output used to make a sealant sign-off decision.
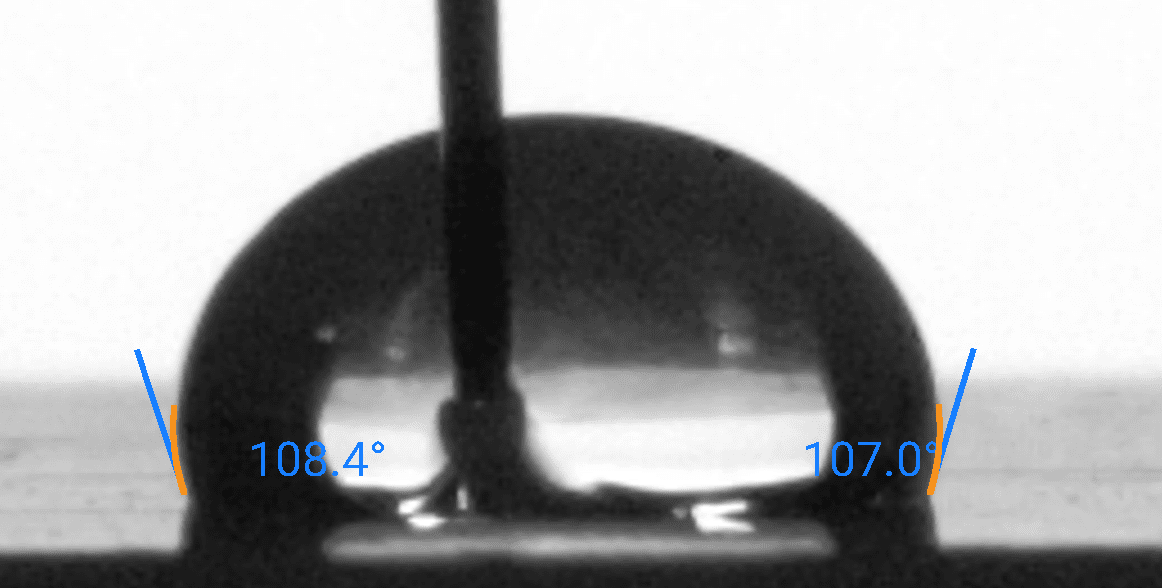
Sessile drop contact angle measurement: DI Water on Teflon surface, left contact angle 108.4°, right 107°

Sample Sealant Bead QC Log: Multiple Zones, Same Joint

Zone Contact Angle (°) Tilt Roll-Off Column 4
Zone A — Bead centre, mid-joint 106° 12° Within range
Zone B — Bead centre repeat 104° 14° Within range
Zone C — Corner/transition zone 91° 29° Degraded, monitor
Zone D — Start point (contamination suspected) 74° No roll-off at 60° tilt Failure
Zone E — Same joint, 30 days later, post-cleaning 88° 22° Degraded vs. day-one baseline

Zone D, at the bead's start point, reads well below baseline with no roll-off at all, consistent with contamination or an incomplete cure at the point where the bead was started. Zone C shows moderate degradation at a corner transition, a common technique-variability point where pressure and angle are harder to hold steady. Zone E, re-measured 30 days later after routine cleaning, shows measurable durability loss versus the day-one baseline, worth tracking against the durability-degradation root cause rather than treating as a new failure. This output would be included in the sealant application QC record for this job.

QC-Ready Quick Protocol (SOP Card)

Simple checklist for pre-bond release gating

Goal: Prevent adhesive failure before bonding by screening surface readiness and triggering corrective actions before assembly.

Sample Handling

  • Enforce no-touch zones and glove/fixture rules
  • Record time since surface prep and storage conditions

Setup

  • Level part and lock lighting/fit settings
  • Include a known-good control coupon every run

Measurement

  • Run fixed droplet volume at fixed timepoint
  • Measure multiple zones when failures are intermittent
  • Record median + IQR per zone

Release Rules

  • PASS: proceed to bonding
  • MONITOR: hold + re-clean/re-treat
  • FAIL: stop + troubleshoot
Troubleshooting

Sealant application troubleshooting guide

Start condition: callbacks, leaks, or inconsistent sealant performance are increasing. Use the signal pattern to identify the most likely cause.

Signal A

Lower contact angle than expected, unstable droplet readings

Likely cause: Cure drift; the sealant did not fully cure.
Action: Check cure time against the product's temperature and humidity specification. Re-measure after full cure time has elapsed.

Signal B

High variability across spots on the same bead

Likely cause: Contamination on the surface before application.
Action: Review the pre-application cleaning step and handling protocol (gloves, no-touch rules).

Signal C

Mixed wetting behavior along the length of the bead

Likely cause: Poor application technique; uneven pressure or inconsistent speed.
Action: Retrain on holding the gun steady with consistent pressure and speed along the full joint.

Signal D

Increased droplet pinning after cleaning, UV, or abrasion exposure

Likely cause: Durability degradation of the sealant over its service life.
Action: Compare against the day-one baseline; if degradation is faster than expected, review formulation choice or cleaning chemical exposure.

FAQ

Common questions before adoption

No. Good wetting behavior is a strong indicator, not a guarantee. It tells you the bead is behaving like a properly cured, uncontaminated sealant should — full waterproof confirmation still comes from your leak test.

There is no universal threshold. You establish your own PASS / MONITOR / FAIL gates by correlating measured contact angle and tilt behavior to your own leak-test results and field-complaint history.

A five-spot contact angle and tilt check typically takes under 10 minutes including setup, measurement, and logging, once the sealant has cured.

Partially. The signal pattern (which metric moved, and where along the bead) narrows the cause to cure, contamination, technique, sealant selection, or durability degradation, per the Root Causes and Troubleshooting sections.

Yes. Re-measuring contact angle and tilt behavior after cleaning, UV exposure, or abrasion, and comparing against the day-one baseline, is how the durability-degradation root cause is tracked.

Yes. The Dropometer produces numeric contact-angle and tilt logs with replicate data, timestamps, and applicator records, usable in NCR responses, CAPA files, and client sign-off documentation.

A silicone sealant bead can look perfectly applied and still fail in real-world waterproof performance. Visual inspection cannot detect the wetting-behavior change this screen is built to catch.

Business Impact

What Changes When You Verify Before You Leave the Job

Before and with Dropometer; operational outcomes

Metric Before Dropometer With Dropometer Column 4
Failure discovery point After a leak, a callback, or a client complaint Post-cure sign-off at the job site, before the crew leaves "COPQ from late-discovered defects typically 15–20% of revenue for manufacturers and applicators without upstream gates"
Root cause identification Trial-and-error across cure, contamination, technique, and formulation Signal pattern narrows the cause within one QC cycle "Structured data-driven diagnosis vs. iterative trial-and-error"
Callback and rework cost Full re-visit: labor, materials, and schedule disruption Bad beads caught and corrected before sign-off "$1 caught upstream vs. $10 in rework, per COPQ prevention-to-failure benchmarks"
Applicator-to-applicator variation Unmeasured; no way to distinguish technique from material or surface issues Tracked per job, per applicator, per zone "Replicate spread detects technique issues not visible to the eye"
Client/audit documentation Subjective visual walkthrough; not defensible under dispute Numeric contact-angle and tilt logs with timestamps and job ID "Applicable to NCR, CAPA, and client sign-off documentation"

Instant ROI Snapshot

Sealant QC ROI Snapshot

Estimate avoided callbacks and reapplication cost.

Each Dropometer unit is $5,000 — default models 1 unit.
Callbacks traceable to sealant application quality specifically, not all callbacks.
Labor, travel, and schedule cost of a site revisit to redo one joint.
Conservative share of callbacks this screen catches before the crew leaves.
Sealant and consumables cost for one redo, not blanket material spend.
Reduced dispute and troubleshooting time from numeric sign-off records.

Result

~0
Monthly savings
~0
Payback period
~0
Year-1 net benefit

Monthly savings = preventable rework cost + preventable scrap cost + other monthly savings.

Honest scope

What Contact Angle Measurement Cannot Tell You

Knowing the limits of any measurement tool is part of using it responsibly.

Beading does not equal a full waterproof seal — good wetting behavior is a strong upstream indicator, not confirmation.
v
Environmental conditions (temperature, humidity, airflow) at the time of measurement affect readings; keep conditions consistent across a comparison.
Respect the instrument's limits; tilt measurement is capped at the top of its tilt range, and very fast pinning or release events can exceed the camera's frame rate.
No universal contact angle threshold exists for sealant sign-off; PASS/MONITOR/FAIL gates must be built per sealant product and substrate, correlated to your own leak-test data.
Use wetting metrics as an upstream quality gate, then confirm final suitability with your established leak test or bond-strength acceptance test.

Use this page to improve prevention and job-site troubleshooting, not to replace a leak test. The Dropometer is one layer in a quality system, not a substitute for one.

How this page was created

Editorial and technical transparency notes for this page.

Transparency Details 4 checklist items
01

Drafting assistance

Initial draft created with AI assistance (Claude 4.8 Opus Pro), then rewritten for technical clarity by Droplet Lab Staff

02

Transparency Note

Technical review and editing by a surface-science specialist for accuracy

03

Transparency Note

Identifiers, units, thresholds, and key claims checked against cited sources before publication

04

Transparency Note

Reviewed every 12 months or when underlying standards or instrument specifications change

Report a correction

Spotted an issue in this summary? Send a correction request and our team will review it.

Correction Request

We work hard to keep this standards summary accurate and up to date. If you spot an error (wrong revision/year, missing requirement, incorrect interpretation, or broken link), tell us and we'll review it.

Contact us to report a correction


References

Sources

1.
ASTM C920-18(2024) — Standard Specification for Elastomeric Joint Sealants. Current, active edition. https://webstore.ansi.org/standards/astm/astmc920182024
2.
Chen, X. et al. Contact angle measurement with a smartphone. Review of Scientific Instruments, 89, 035117 (2018). https://pubs.aip.org/aip/rsi/article-abstract/89/3/035117/368179/Contact-angle-measurement-with-a-smartphone
3.
Fabrico. The Cost of Poor Quality (COPQ) in Manufacturing: 2026 Guide. https://www.fabrico.io/blog/cost-of-poor-quality-copq-manufacturing-guide/
4.
Making Strategy Happen. The Cost of Quality: The 1-10-100 Rule. https://www.makingstrategyhappen.com/the-cost-of-quality-the-1-10-100-rule/