Stop Fisheye and Crater Defects: Coating Failure Prevention with a Pre-Spray Wetting and Surface Tension Gate
Add a numeric, audit-ready wetting and surface-tension screen between surface preparation and spray. Stop fisheye, crater, and dewetting defects that trace back to contamination, low surface energy, or coating formulation drift before the coating is ever applied.
Who this is for: Process engineers, QA/QC teams, and manufacturing leads running paint or coating lines (including automotive and industrial spray operations) where substrate contamination and coating surface-tension drift drive fisheye, crater, and dewetting defects.
Positioning: Dropometer strengthens your coating-defect prevention workflow. It does not replace final visual/appearance inspection or coating-thickness QC; it adds a fast, quantitative wetting and surface-tension screen that catches the contamination and formulation drift that cause defects, before spray.
Droplet Lab Team
Droplet Lab builds precision instruments and software for surface science measurement, specialising in contact angle analysis and surface tension characterisation. Used by researchers across materials science, pharmaceuticals, coatings, and advanced manufacturing, Droplet Lab's Dropometer has contributed to studies published in peer-reviewed journals including Advanced Functional Materials (Impact Factor 19). The team combines instrument engineering with deep domain knowledge in wettability science with a focus on practical accuracy.

The Cost Of Getting It Wrong
10×
higher hidden cost vs. visible scrap cost: rework, re-inspection, downtime, and warranty claims are rarely captured
Fabrico COPQ Guide 2026
1 → 10 → 100
the well-documented "1-10-100 Rule": a defect caught at prevention costs roughly 1x, caught internally (rework/scrap) roughly 10x, and escaping to the customer (warranty, recall, lost business) roughly 100x
1-10-100 Rule of Quality Costs (Making Strategy Happen; AIGPE)
Sources: Fabrico, "The Cost of Poor Quality (COPQ) in Manufacturing: 2026 Guide" (fabrico.io); Making Strategy Happen and AIGPE on the 1-10-100 Rule. Figures are industry-wide benchmarks, not Droplet Lab claims, and not specific to any one failure mode on this page.
What this workflow does and what it does not
Quick technical reference for engineers and QA managers evaluating fit before reading further.
Evidence Box (QC-Ready)
Fisheye, crater, dimple, and coating-crawl defects discovered after spray, cure, or final inspection, where the root cause was substrate contamination (silicone, oil, grease, wax), low substrate surface energy, or coating surface-tension/formulation drift that occurred upstream.
A fast quantitative screen immediately before spray (substrate wetting) and before loading coating into the gun (surface tension), plus a structured troubleshooting tool when defect rates begin to trend. Not a replacement for final appearance inspection or coating-thickness QC.
Water contact angle (static, advancing, receding) at a fixed time before spray
Spot-to-spot variability across zones (IQR/SD) to locate contamination hotspots
Optional tilt/hysteresis reading to reveal hidden surface heterogeneity
Pendant-drop surface tension of the coating or process liquid
Optional surface energy trend using Fowkes or van Oss–Good models
10–20 representative panels spanning pass and fail (fisheye/crater vs. clean) outcomes
Minimum 2 operators
Locked probe fluid, droplet volume, capture time, and replicate count, tracked per substrate and coating system
PASS / MONITOR / FAIL thresholds must be set by correlating measured wetting and surface-tension signals to your actual defect-rate and appearance-standard outcomes; substrate- and coating-system-specific, not universal.
Contact angle and surface tension are process-risk indicators, not direct proof of defect-free coating or chemical identification of a contaminant. Additive/formulation control and final appearance inspection require separate process controls.
What are you trying to solve?
The Dropometer serves four roles across a coating operation. Each has a different primary risk.
Process Engineer
Investigating batch-to-batch or shift-to-shift variation in fisheye/crater rates with no clear root cause, especially after a change in cleaning chemistry, substrate supplier, or coating formulation.
QA / QC Manager
Needing a numeric upstream gate before spray to reduce repaint, refinish, and scrap costs and improve first-pass yield.
Compliance Officer
Requiring documented, defensible evidence of surface and coating readiness for NCR files, CAPA responses, or customer/supplier audits.
Lab Manager
Setting up a reproducible measurement protocol for incoming substrate inspection or coating-batch verification across operators and shifts.
Is this the right screen for your process?
This is not a universal solution. Check the conditions below before investing further time.
Good fit if
Less relevant if
Why Coating Defects Start Before the Spray Gun Fires
In most coating lines, fisheye and crater defects are a late symptom. The root cause is earlier and preventable with the right upstream gate.
Fisheye, crater, and dewetting defects are typically discovered after spray, cure, or final inspection — once rework or scrap is the only option left. The defect is often blamed on the coating formulation. In many cases the formulation is not the problem: the substrate carried trace contamination (silicone, oil, grease, or wax), had low native surface energy, or the coating itself had drifted in surface tension before it was ever sprayed.
Fisheye formation is a well-documented surface-tension phenomenon: a small zone of lower surface tension, typically from a contaminant such as silicone, oil, or wax, causes the wet film to retract locally, leaving a crater or dimple as it levels and cures [1][2][3]. Common upstream causes include substrate contamination from handling, spray dust, or compressed air; low native surface energy on plastic, composite, or poorly prepped substrates; coating surface-tension drift from solvent, additive, or dilution changes; additive imbalance, including overcorrection with a fisheye eliminator; and process or environmental drift such as compressor-air contamination or a delay between prep and spray. All of these are measurable before the coating is applied.
This workflow adds a quantitative upstream gate. First, measure substrate wetting readiness immediately before spray. Second, measure coating surface tension before it is loaded into the gun. Third, use the same measurement logic for troubleshooting when defect rates begin to trend. The goal is not to predict final appearance from one number. The goal is to reduce false passes, identify root cause faster — substrate contamination vs. low surface energy vs. coating drift vs. process drift — and catch defects before the coating is committed to the part.
What Do Coating Defects Actually Look Like?
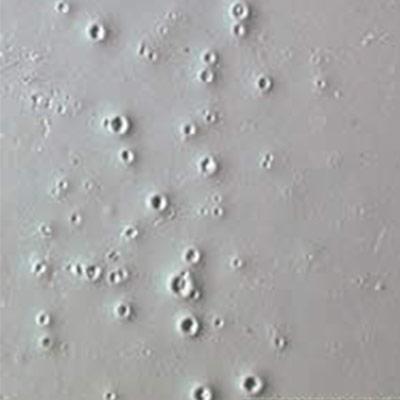
Many teams struggle to keep fisheye, crater, and dewetting defects out of a coating line even with a well-specified coating, because contamination or low surface energy can cause failures that look random from the outside.
Root Causes
Why:
- Even trace silicone in shop air, a silicone-based mold release, or handling oils creates unwettable micro-zones on the substrate. The coating retracts from these zones as it wets and levels, producing fisheyes or craters independent of whether the bulk substrate was otherwise properly prepared.
How to detect:
- Contact angle rises above your known-good baseline in the affected zone Replicate spread (IQR/SD) increases at contamination hotspots Edge, fixture-contact, or handling-zone patterns emerge in spatial testing Re-cleaning a sample improves wetting measurably
Corrective action:
- Standardize degreasing/cleaning chemistry Add no-touch handling rules pre-spray Improve air filtration and compressor moisture/oil traps Re-check surfaces immediately after cleaning; run a clean control coupon every shift
Why:
- Plastic, composite, fiberglass, or poorly prepped metal substrates have inherently low native surface energy, resisting wetting even when the surface looks visually clean.
How to detect:
- Persistently high contact angle after cleaning, with no contamination signature Angle does not improve after re-cleaning alone
Corrective action:
- Add plasma, corona, or flame treatment Apply a compatible primer Control the timing between treatment and spray; treated surfaces lose surface energy over time (hydrophobic recovery)
Why:
- Changes in solvent ratio, additive dosing, dilution, or contamination in the liquid coating alter its surface tension and flow behavior independent of the substrate.
How to detect:
- Pendant-drop surface tension trend shifts between batches Defects appear even on freshly verified, known-good substrate
Corrective action:
- Lock mixing ratio, filtration, and dilution procedures Measure coating surface tension before loading the gun Audit raw-material lot changes
Why:
- Excess or incompatible flow/wetting additive, including a fisheye eliminator added reactively to firefight an existing defect, can overcorrect and change flow and leveling behavior.
How to detect:
- Surface tension changes without any corresponding substrate change New defects (cratering, poor flow) appear after an additive adjustment
Corrective action:
- Run controlled dosing trials rather than ad hoc additions Optimize additive level against a measured surface-tension target Document additive changes alongside defect-rate data
Why:
- Moisture, dust, compressed-air contamination, or a delay between surface prep and spray lets the substrate or booth environment drift between a passing check and the actual spray event.
How to detect:
- Wetting tests pass at setup but defect rates rise later in the shift Correlates with time-since-prep or booth-condition logs rather than the prep step itself
Corrective action:
- Control spray-booth humidity and temperature Maintain compressor air dryers and hose cleanliness Shorten or enforce the prep-to-spray time window
Not sure which root cause applies to your process?
A surface science specialist can review your failure history and help you identify whether a surface screen would add a useful upstream gate.
Building a defensible pre-bond inspection record
Surface and coating readiness measurement produces the type of numeric, traceable output that subjective visual methods cannot. If your quality system requires documented evidence of process control at each stage for NCR responses, CAPA files, incoming inspection records, or supplier audits, contact angle and surface tension measurement provide that evidence in a format your QA documentation already requires. No specific external regulation governs coating pre-spray wetting inspection, so this is offered as internal QC documentation value, not a compliance-avoidance claim.
Audit trail
Numeric contact-angle and surface-tension values with replicate spread, timestamps, operator records, and substrate/coating lot identification; replacing subjective "surface looked clean" notes with defensible numeric logs.
CAPA evidence
When defect rates trigger a Corrective and Preventive Action file, contact-angle and surface-tension data provide quantitative before/after evidence of substrate and coating condition; not anecdotal process descriptions.
NCR documentation
Non-conformance reports that include numeric pre-spray data let you assign root cause, substrate, coating, or process with evidence, not inference.
Coating-system qualification
Incoming substrate or new coating-lot verification using contact angle and surface tension provides a numeric acceptance criterion, applicable to ISO 9001, IATF 16949, and similar quality systems.
Process control records
Contact-angle and surface-tension trend logs demonstrate statistical process control at the pre-spray step; relevant to Six Sigma, SPC, and DMAIC programs targeting coating-line COPQ.
Treatment verification
For plasma, corona, or primer treatment that's difficult to verify visually, contact angle measurement provides objective confirmation that treatment reached the required level before spray.
What to Measure
Water contact angle at fixed time before spray
Why it matters: This is the fastest screen for whether a substrate is prepared and ready for coating wetting.
How to interpret: Higher angle usually means poorer wetting and higher fisheye/crater risk. Rising angle versus your baseline indicates contamination or under-preparation.
When it is not enough: Contact angle confirms wetting readiness, not final appearance or defect-free coating.
Spot-to-spot variability (IQR/SD)
Why it matters: A single average can hide a localized contamination hotspot. Variability is often what reveals an intermittent fisheye/crater problem.
How to interpret: Low variability suggests a uniform, well-prepared surface. High variability suggests contamination or uneven treatment.
When it is not enough: High spread signals a non-uniform surface but does not identify whether the cause is contamination or under-treatment.
Advancing/Receding Angle (hysteresis)
Why it matters: Detects hidden surface heterogeneity that a single static angle misses, useful when static measurements are inconclusive.
How to interpret: Higher hysteresis versus baseline suggests contamination or a change in surface roughness/energy.
When it is not enough: Sensitive to surface roughness, not just contamination; cross-check against spatial (IQR) data.
Sliding/Tilt Behavior
Why it matters: Shows droplet mobility differences that flag contamination or uneven prep.
How to interpret: Irregular sliding motion indicates contamination or uneven treatment.
When it is not enough: Affected by surface texture; the instrument's tilting stage covers 0–60° per datasheet, which covers the large majority of coating roll-off/contamination checks but should be confirmed against any internal spec requiring a wider tilt range.
Surface Tension (Pendant Drop)
Why it matters: Critical for coating flow and leveling; even good substrate wetting can be undermined by surface-tension drift in the coating itself.
How to interpret: Drift outside the expected range for a coating or process liquid indicates solvent, additive, or formulation drift worth investigating before it reaches the spray booth.
When it is not enough: Does not chemically identify a contaminant, and is not a substitute for final appearance/defect inspection.
Validated Measurement Approach
Independent benchmarking and publication-based validation references.
Benchmark Validation
Dropometer contact angle and pendant-drop surface tension methods have been benchmarked against KRÜSS DSA100E reference measurements. The instrument is referenced in peer-reviewed journals including Bioactive Materials (Impact Factor 20) and Advanced Functional Materials (Impact Factor 19).
See peer-reviewed validationPublication Evidence
Our instruments are referenced in peer-reviewed journals, theses, and conference publications.
Browse citationsHow Dropometer Fits Your Workflow
Dropometer is best used as a pre-spray QC screen and as a structured troubleshooting step after coating defect rates begin to trend.
Establish Baseline
Measure known-good panels: Contact angle distribution on the clean substrate Surface tension of the coating
Pre-spray substrate gate
Before spray: Check substrate wetting Identify contamination hotspots across zones
Coating Batch Check
Before loading the gun: Measure coating surface tension Verify solvent and additive consistency against baseline
Diagnose and gate
Use the signal pattern to isolate cause and convert to an operator decision: Compare clean vs. contaminated panels Identify whether the issue is substrate, coating, or process PASS: proceed to spray / MONITOR: repeat and check handling / FAIL: hold, re-clean or re-treat
We completed our gage R&R study on the unit and it performed very well.
Brandon Barbee
Corporate Quality Engineer - Zeus Industries - Polymer Manufacturing
Download the Pre-Bond Surface Screening SOP Template
An editable SOP template your team can adapt for your substrate, adhesive, and preparation route. Includes measurement protocol, gate-setting guidance, and a QC log format ready for your documentation system.
Sample Pre-Spray Contact Angle Log: Multiple Zones, Same Panel
Representative output format. Values are illustrative, not a universal specification.
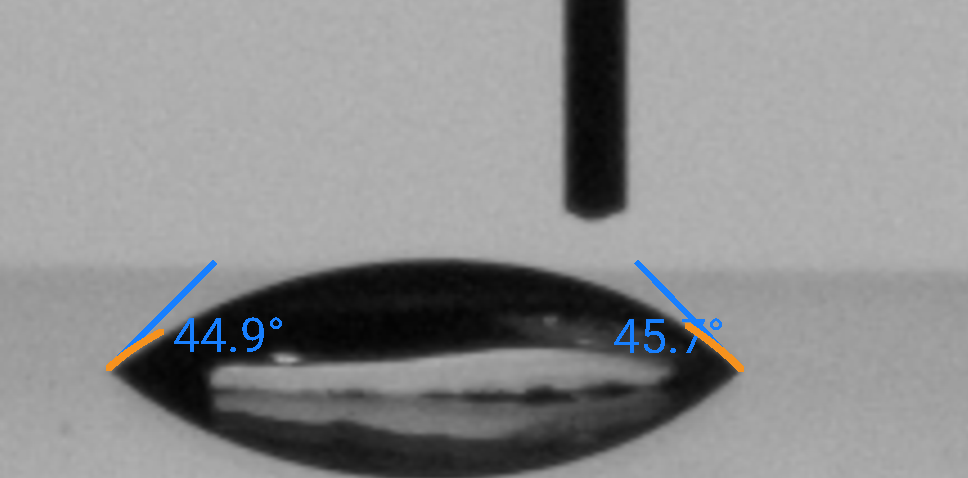
Dropometer contact angle measurement — DI water on glass. Left contact angle and right contact angle shown with fitted tangent lines at each contact point and the baseline overlay. This is the type of output used to make a pre-spray PASS / HOLD decision. Glass is used here as the representative clear/gloss substrate from the available reference image set; substitute a coating-line-specific substrate image if/when available.
Table Heading: Sample Pre-Spray Contact Angle Log: Multiple Zones, Same Panel
| Zone | Contact Angle (°) | Replicate SD | vs. Baseline |
|---|---|---|---|
| Zone A — Centre | 62.4° | ±1.6° | Within range |
| Zone B — Centre repeat | 63.1° | ±1.9° | Within range |
| Zone C — Edge near fixture | 84.7° | ±6.2° | +21.9° above median |
| Zone D — Handling-oil residue point | 101.8° | ±9.1° | +39.0° above median |
| Zone E — Centre, coating batch re-check | 74.3° | ±3.4° | +11.6° above median (coating surface-tension drift) |
Zone D indicates residual handling oil at a fixture-contact point; the panel is held for re-cleaning before spray proceeds. Zone E shows a pendant-drop surface-tension check on the coating batch reading outside the established range — consistent with formulation or additive drift, not a substrate contamination event. Zones A and B cleared; Zone C flagged for a follow-up check after re-handling. This output would be included in the pre-spray QC record for this coating lot.
Coating defect troubleshooting guide
Start condition: fisheye, crater, or coating-defect complaints are increasing. Use the signal pattern to identify the most likely cause.
Contact angle is high versus your established baseline
Likely cause: Contamination (silicone, oil, grease, wax) or under-preparation of the substrate.
Action: Hold affected panels. Re-clean the surface, then re-measure promptly. If angle drops significantly after re-cleaning, contamination was the cause. Investigate where in the process the contamination was introduced.
Median looks acceptable but replicate spread (IQR/SD) is high
Likely cause: Localized contamination or uneven treatment coverage at specific zones on the part.
Action: Test fixed locations — centre, edges, known handling points. Isolate the source by zone. Correct handling procedure or treatment coverage and revalidate.
Substrate wetting looks normal but coating defects continue
Likely cause: Coating surface-tension drift, additive imbalance, or a formulation issue rather than a substrate problem.
Action: Measure the coating's pendant-drop surface tension against your baseline before it goes into the gun. Audit recent additive, solvent, or dilution changes.
Wetting and surface tension pass at setup but defect rate rises later in the shift
Likely cause: Process/environmental drift — booth humidity, compressed-air contamination, or a widening prep-to-spray delay.
Action: Audit booth conditions and compressor air-dryer performance; shorten or enforce the prep-to-spray time window.
Common questions before adoption
No. The Dropometer is an upstream screening tool. It measures substrate wetting readiness and coating surface tension before spray. It does not measure final coating appearance, gloss, or thickness. Your existing appearance-standard inspection remains the acceptance test for finished parts. What it replaces is the current absence of any pre-spray gate.
There is no universal threshold. Acceptable wetting and surface-tension values depend on your substrate, coating chemistry, and treatment route. You establish your own PASS / MONITOR / FAIL gates by correlating measured values to your historical defect-rate outcomes for that specific combination.
A five-spot contact angle check plus a coating surface-tension reading typically takes under 10 minutes including setup, measurement, and logging. Most teams run the check immediately before spray, without needing a dedicated lab environment.
This varies by substrate, treatment method, and storage conditions; there is no single published timeline. Establish your own time-to-spray window from your own contact-angle trend data rather than relying on a generic figure.
Partially. If your pre-spray wetting and surface-tension records were within normal range, that helps rule out substrate contamination or coating drift as the cause. Final defect classification (fisheye vs. orange peel vs. sag) still requires visual/appearance assessment, since some flow defects (like orange peel) are driven by application/rheology factors this screen does not directly measure.
Yes. The Dropometer produces numeric contact-angle and surface-tension logs with replicate data, timestamps, and operator records. These outputs can be included in NCR documentation, CAPA files, incoming inspection records, and supplier audit packages.
Visual inspection cannot detect marginal wettability, quantify coating surface-tension drift between batches, compare lots against a documented baseline, or provide audit-defensible records. Contact angle and surface tension measurement quantify what visual inspection can only estimate.
What Changes When You Screen Wetting and Coating Readiness
Before and with Dropometer; operational outcomes
| Metric | Before Dropometer | With Dropometer | Indicative Benchmark |
|---|---|---|---|
| Failure discovery point | Post-spray, after cure and inspection costs are already sunk | Pre-spray screen — before value is added downstream | "Repaint/refinish costs several times more than an upstream hold and re-clean" |
| Prep-to-spray timing | Unmanaged or assumed from generic guidance | Tracked against a measured contamination/energy-decay trend specific to your line | "Eliminates reliance on time-since-prep assumptions" |
| Troubleshooting cycle | Multi-day, opinion-driven: no numeric baseline to compare against | Same-shift, data-driven — wetting/surface-tension signal isolates substrate vs. coating vs. process as cause | "Structured data-driven diagnosis vs. iterative trial-and-error" |
| Operator-to-operator variation | Unmeasured: no way to distinguish substrate variability from process variability | Tracked per run, per operator, per zone — makes invisible drift visible | "Replicate spread detects handling contamination not visible to the eye" |
| Audit documentation | Subjective notes ("surface looked clean"): not defensible under audit | Numeric contact-angle/surface-tension logs with timestamps, operator records, and substrate/coating lot ID | "Applicable to NCR, CAPA, incoming inspection, and supplier qualification records" |
| Rework and scrap cost | Included in cost standards and often treated as unavoidable | Fisheye/crater-driving defects intercepted before spray — converts late defects to early holds | "COPQ from rework typically 15–20% of revenue for manufacturers without upstream gates" |
Instant ROI Snapshot
Coating Defect ROI Snapshot
Estimate avoided repaint/refinish cost from fisheye, crater, and dewetting defects.
Result
Monthly savings = preventable rework cost + preventable scrap cost + other monthly savings.
What Contact Angle and Surface Tension Measurement Cannot Tell You
Knowing the limits of any measurement tool is part of using it responsibly.
Use this page to improve prevention and upstream troubleshooting, not to oversimplify coating-defect science. The Dropometer is one layer in a quality system, not a substitute for one.
Similar surface readiness workflows
Orange peel paint texture
A related flow/leveling defect, driven more by application rheology than by contamination, see how the diagnostic differs from fisheye/crater screening.
Powder coat adhesion and peeling
Screen substrate readiness before powder coat application to prevent adhesion failure and peeling.
Silicone contamination detection
A deeper look at the single most common root cause behind fisheye and dewetting defects across coating lines.
How this page was created
Editorial and technical transparency notes for this page.
Drafting assistance
Initial draft created with AI assistance (ChatGPT 5.2 Pro), then rewritten for technical clarity.
Technical review
Reviewed and edited for technical accuracy by a surface-science specialist.
Verification steps
Identifiers, units, thresholds, and key claims checked against cited sources before publication.
Updates
Reviewed every 12 months or when the underlying standard changes.
Report a correction
Spotted an issue in this summary? Send a correction request and our team will review it.
Correction Request
We work hard to keep this standards summary accurate and up to date. If you spot an error (wrong revision/year, missing requirement, incorrect interpretation, or broken link), tell us and we'll review it.
Contact us to report a correction